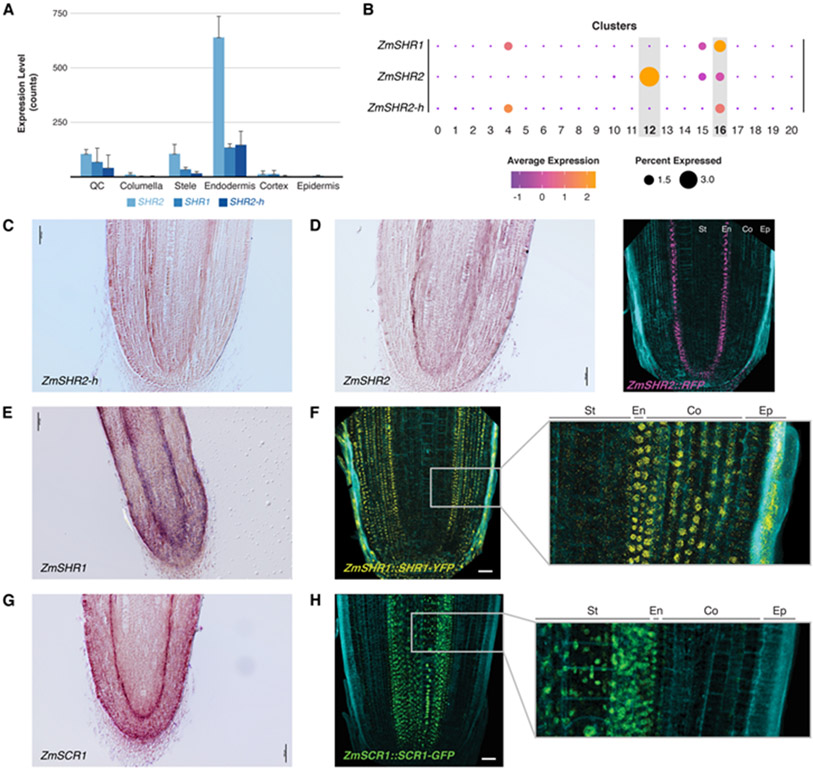
Fig. 3. SHR and SCR expression in maize endodermis and differences between transcriptional and translational reporters.
(A) Expression of the three ZmSHR paralogs (SHR1,2,2-h) from sorted cells. Error bars are standard deviation. (B) Dot plots representing single cell analysis showing expression of ZmSHR paralogs in endodermis and, at a low level, stele. (C,D) ZmSHR2h in-situ hybridization showing endodermal expression. (D) ZmSHR2 in-situ hybridization and transcriptional reporter. (E) In-situ hybridization of ZmSHR1. (F) Translational reporter for ZmSHR1 with inset showing protein movement into cortex layers. (G) In-situ hybridization of ZmSCR1. (H) Translational reporter SCR1-GFP reporter showing movement into the stele. Scale bars are 50 μm. Cyan in confocal images is autofluorescence at Ex/405.

