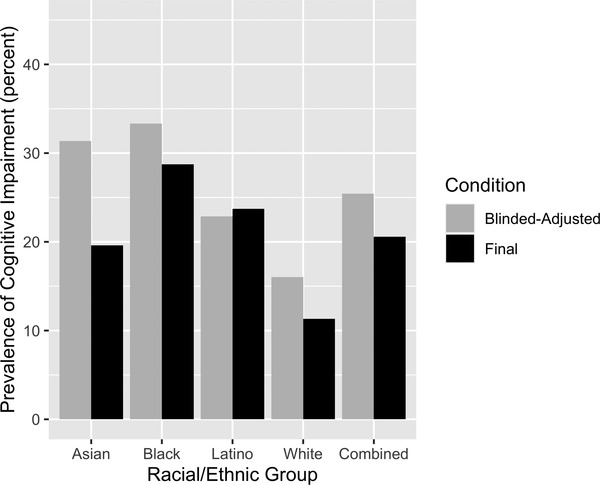
FIGURE 3.

Raw prevalence of cognitive impairment by racial/ethnic group; Random Selection group (N = 413). Cognitive impairment = mild cognitive impairment or dementia, blinded‐adjusted = diagnosis based on clinical exam results and demographically adjusted neuropsychological scores (adjusted for race/ethnicity, gender, and education), blind to the demographic characteristics of the individual. Final = diagnosis based on all available information (clinical exam results, demographically adjusted neuropsychological scores, unadjusted neuropsychological scores, and participant's demographic characteristics). (Estimated values are presented in Supplementary Table 2, Supplementary Materials)
