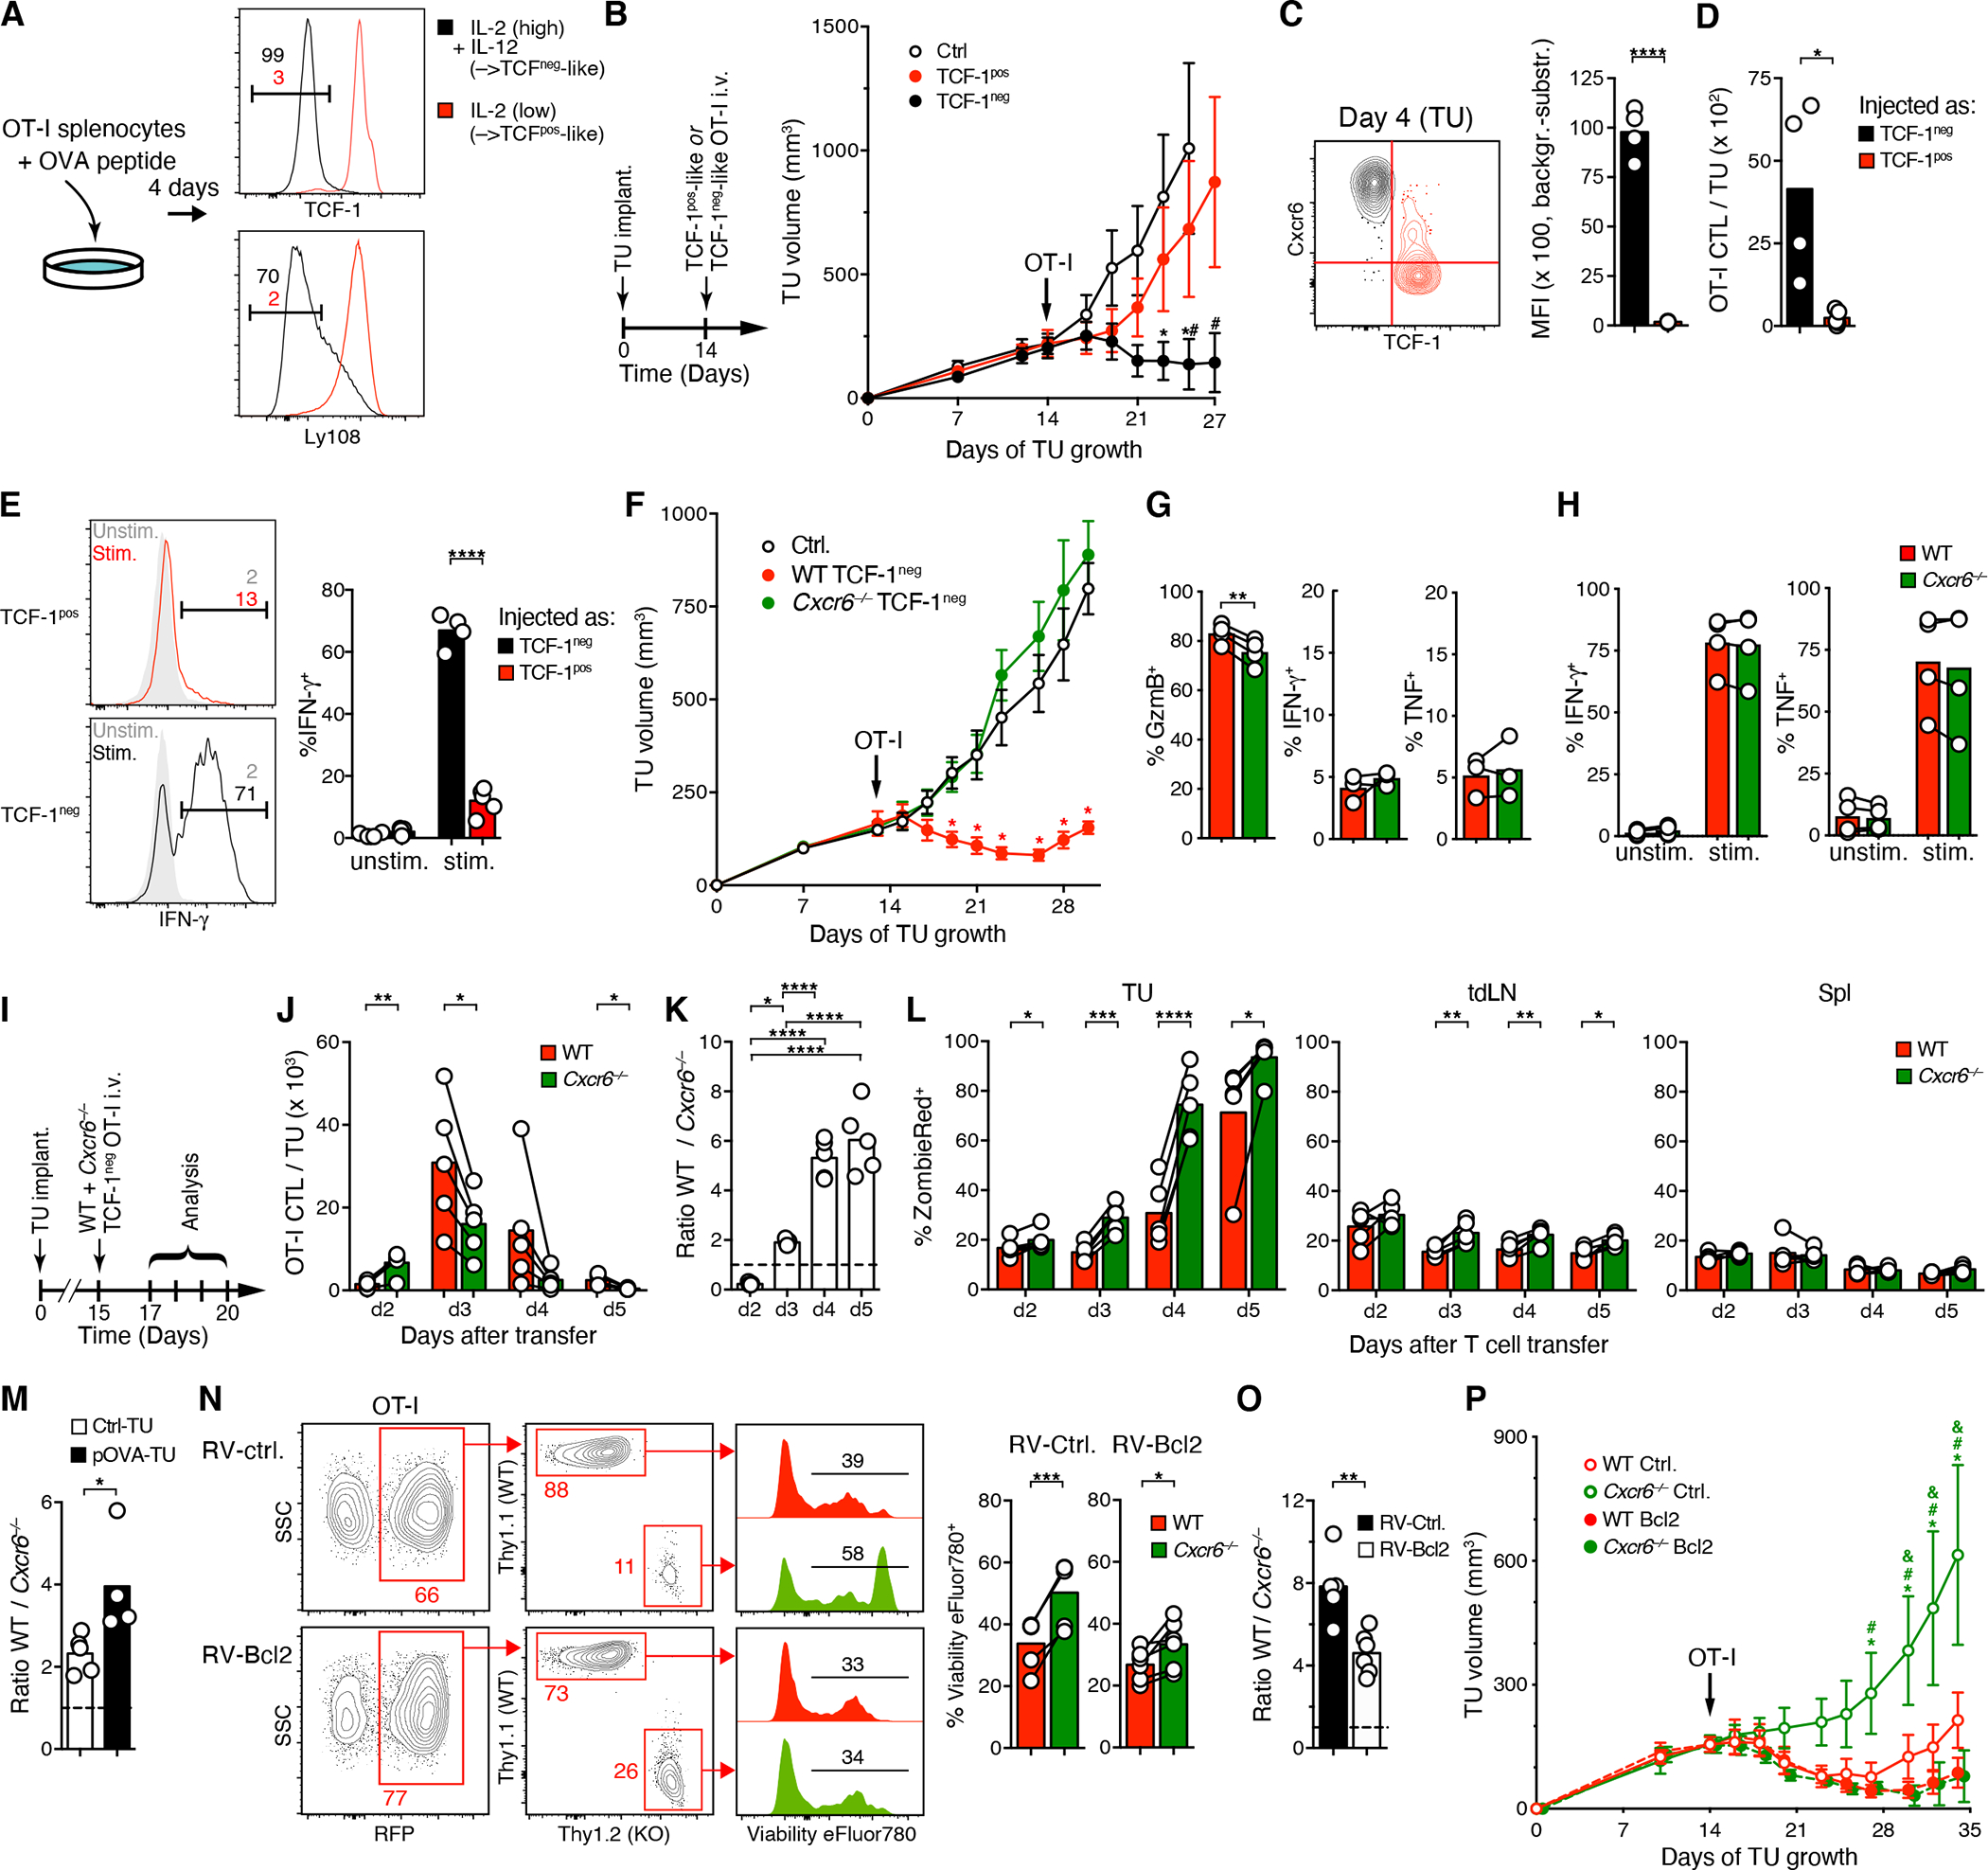
Figure 3: CXCR6 supports survival of TCF-1neg CTL in the TME to enable their anti-tumor activity.

(A) Culture of peptide-activated WT or Cxcr6−/− OT-I splenocytes in low rIL-2 (5 ng/ml) or in high rIL-2 (20 ng/ml) and rIL-12 (10 ng/ml) to generate TCF-1pos-like or TCF-1neg-like OT-I CTL, respectively.
(B) D4M.3A-pOVA tumor growth following i.v. injection of 106 TCF-1pos-like or TCF-1neg-like OT-I CTL.
(C) Overlaid contour plots of CXCR6 expression on tumor-infiltrating OT-I cells 4 days after injection of TCF-1pos-like (red, gated on cells that remained TCF-1pos) or TCF-1neg-like (black) cells into tumor-bearing mice on day 14.
(D, E) Frequency (D) and ex vivo-stimulated IFN-γ expression (E) of the same cells as shown in (C).
(F) Growth of D4M.3A-pOVA tumors following i.v. injection on day 13 of 106 either WT or Cxcr6−/−TCF-1neg-like OT-I as generated in (A) or in non-injected animals (Ctrl.).
(G, H) In situ-expression of Granzyme B, IFN-γ, and TNF (G) and ex vivo-stimulated expression of IFN-γ and TNF (H) by tumor-infiltrating OT-I cells on day 4 following i.v. injection of TCF-1neg-like cells, as described for (F).
(I-L) WT and Cxcr6−/− TCF-1neg-like OT-I cells were co-injected into tumor-bearing mice on day 15 and their respective frequencies and ratios in tumor tissue (J and K) and their ex vivo uptake of the viability dye ZombieRed by cells in tumors, tdLNs, and spleens (L) were assessed at the indicated time-points thereafter.
(M) Ratios of tumor-infiltrating CTL 4 days after injection of WT and Cxcr6−/− TCF-1neg-like OT-I cells (106) into animals implanted with either D4M.3A-pOVA or D4M.3A tumors into their flanks.
(N, O) WT and Cxcr6−/− TCF-1neg-like OT-I cells were retrovirally transduced to express either Bcl-2 and mRFP (RV-Bcl2) or RFP only (RV-ctrl.) and co-injected into tumor-bearing animals on day 14. Four days later, tumor-infiltrating cells were examined for ex vivo uptake of the viability dye Viability eFluor 780 (N) and their input-corrected ratios (O).
(P) Same cells as described for use in (N, O) were injected into separate tumor-bearing animals and tumor growth was monitored. *, #, and & = p<0.05 vs. WT Bcl2, Cxcr6−/− Bcl2, and WT Ctrl., respectively.
Data in A to M represent at least two independent replicates with similar results. Graphs show means and either individual replicates or ±SEM. */**/***/**** = p<0.05/0.01/0.001/0.0001 in all graphs except for (B), (F), and (P).
