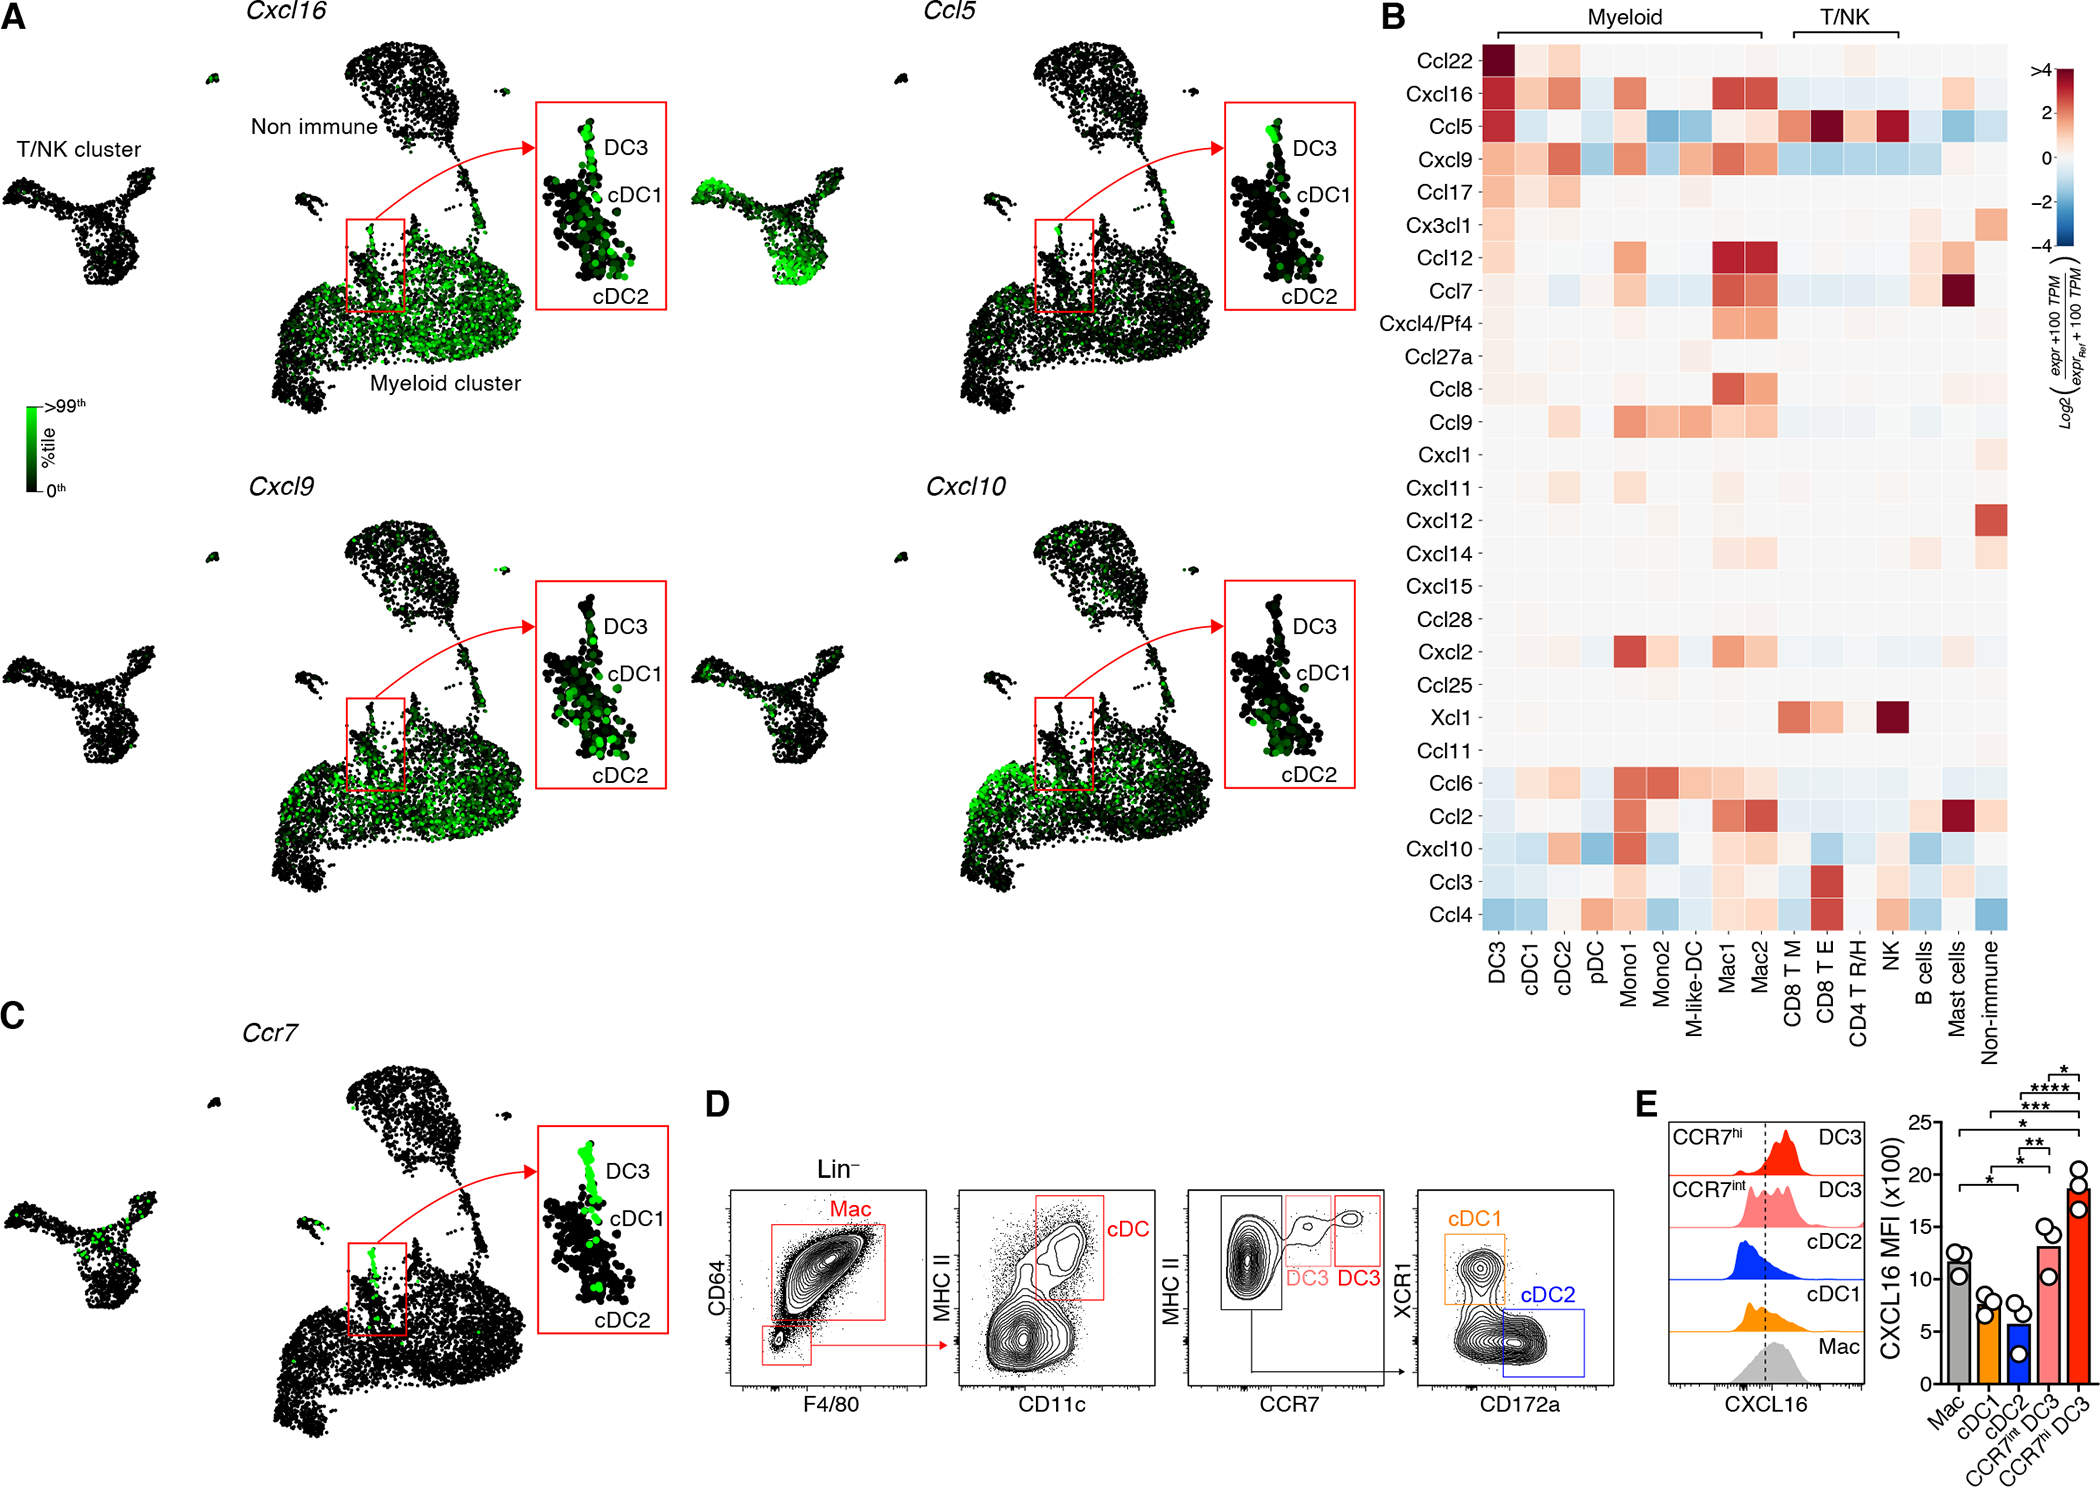
Figure 4: The CXCR6 ligand CXCL16 is most highly expressed by the CCR7+ DC3 state.

(A-C) Single-cell expression of Cxcl16, Ccl5, Cxcl9, and Cxcl10 (A), of CCR7 (C), and heatmap of chemokine gene expression (B) in D4M.3A-pOVA tumors (Neutrophils not shown). See Table S1C for numerical data underlying the heatmap.
(D, E) Total (intracellular and cell surface) expression of CXCL16 protein in APC types.
(D, E) represent two independent replicates with similar results. Graphs show means and individual replicates. */**/***/**** = p<0.05/0.01/0.001/0.0001.
