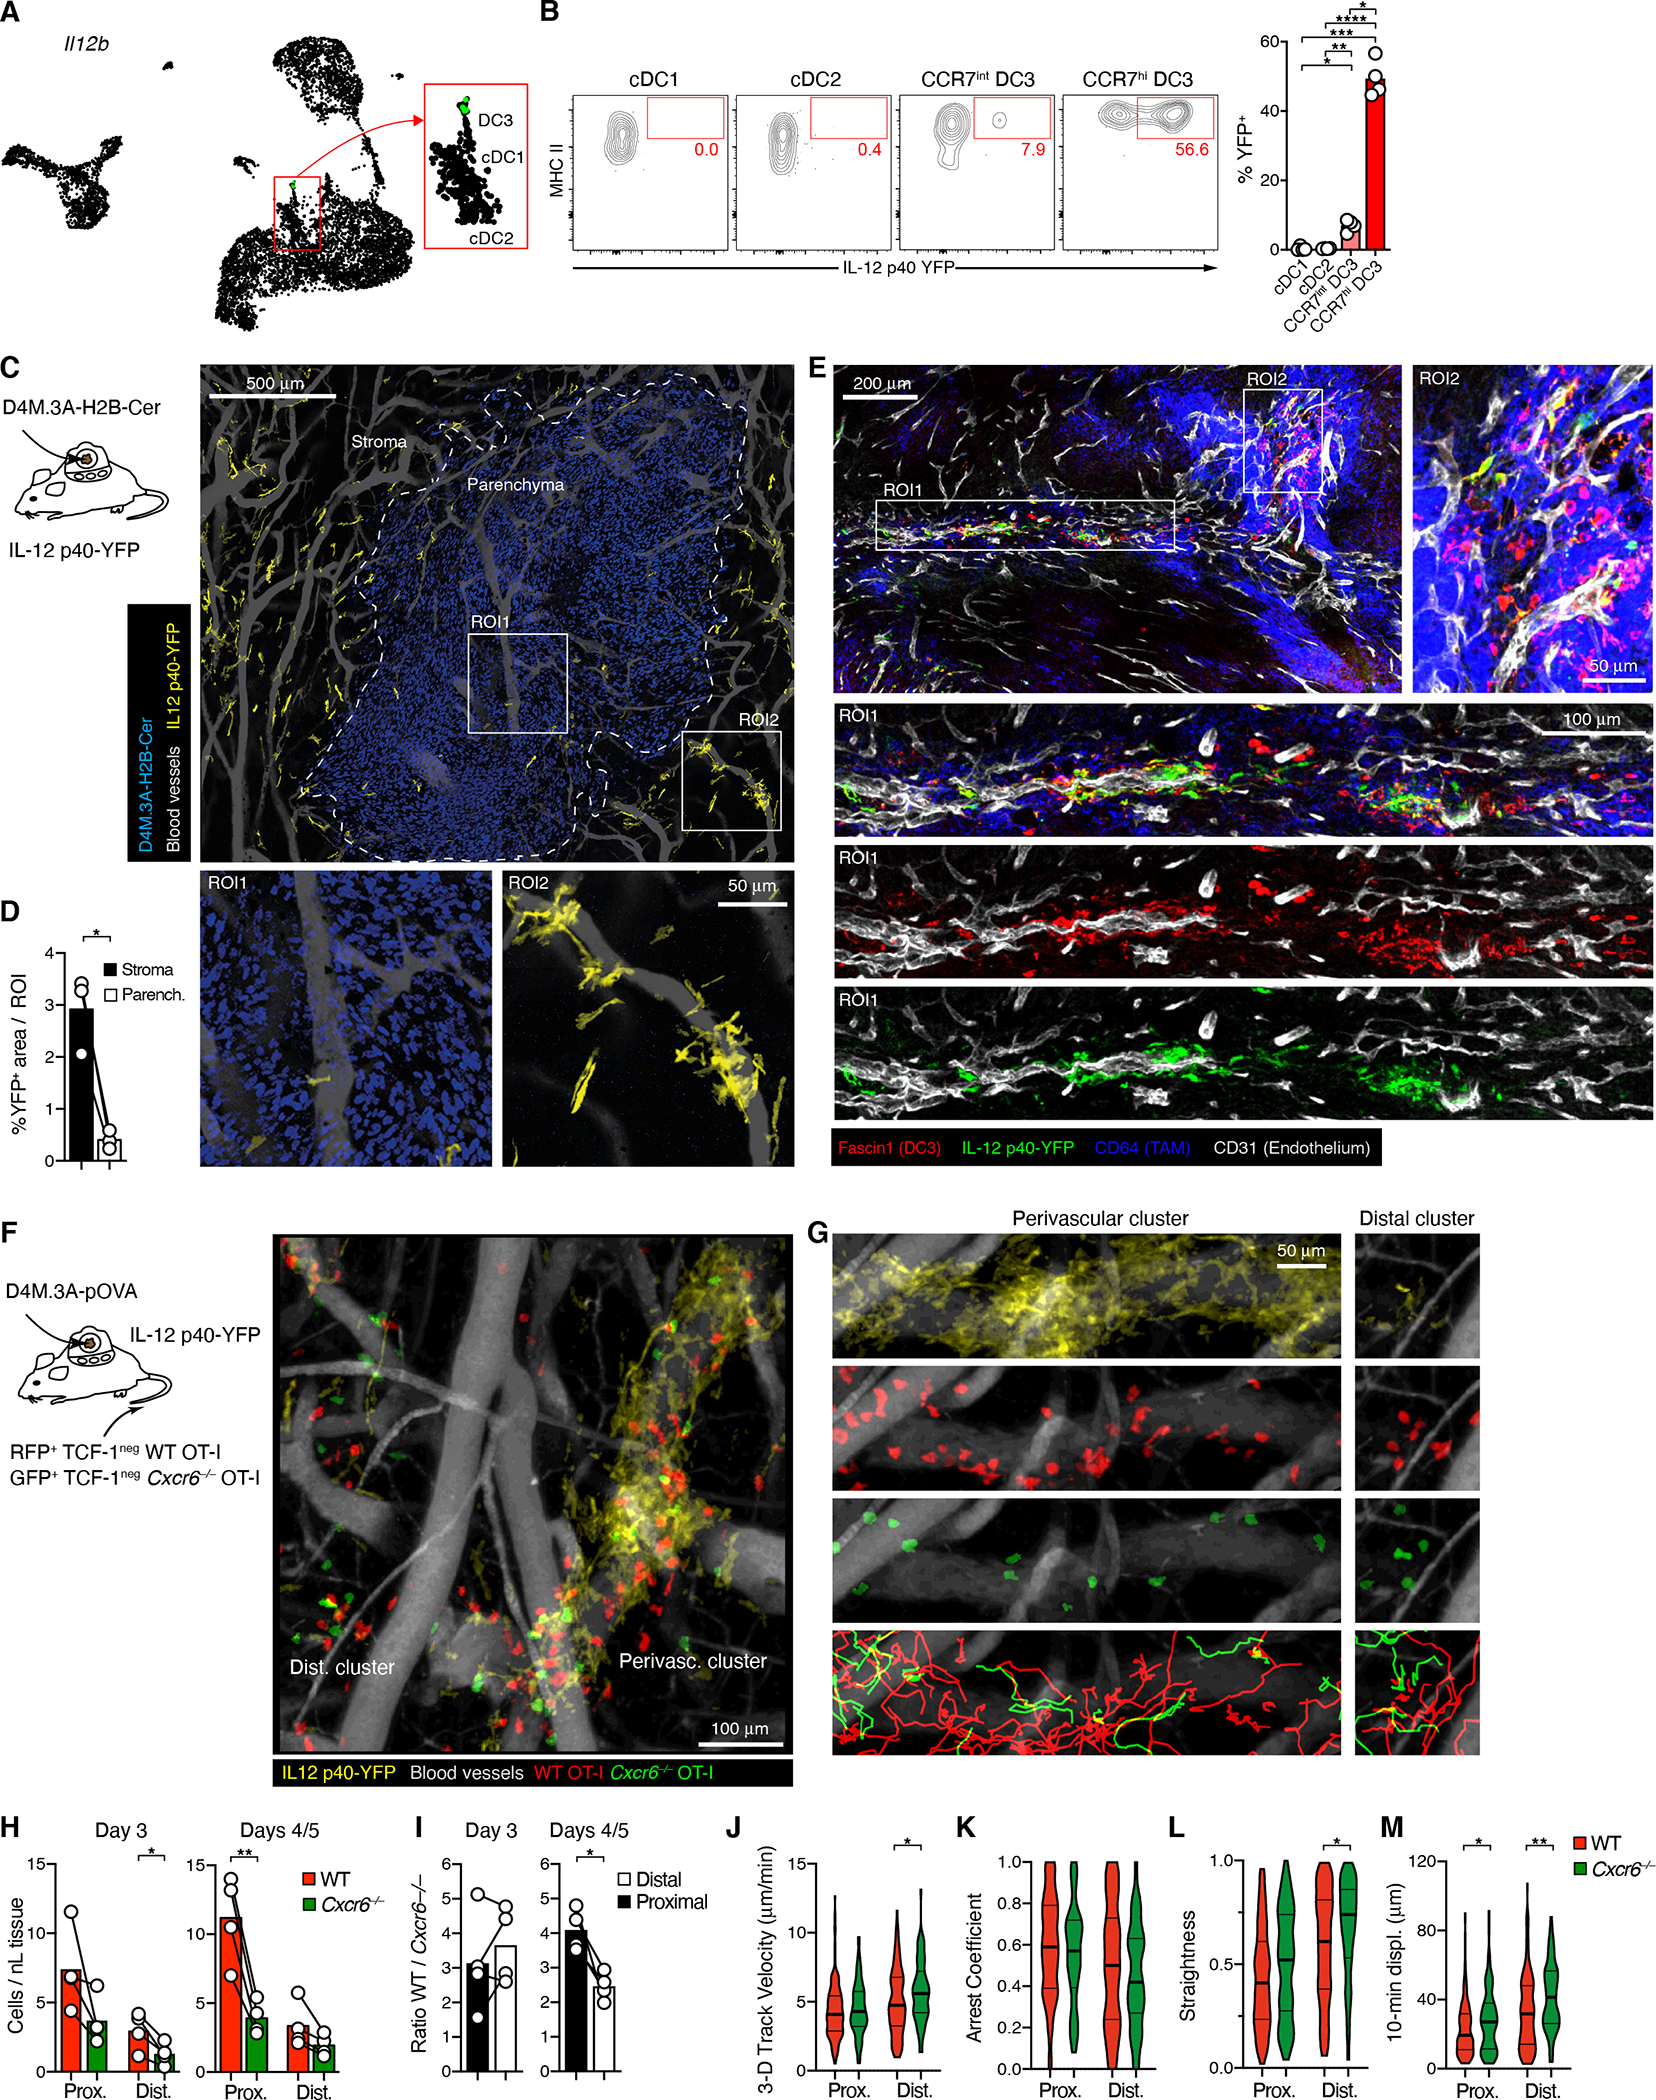
Figure 5: CXCR6 promotes CTL interactions with perivascular clusters of DC3.

(A) Single-cell expression of Il12b in D4M.3A-pOVA tumors.
(B) Expression of YFP in cDC subsets in 18 days-old tumors in IL-12 p40-YFP reporter mice.
(C) Distribution of YFP+ DC3 in D4M.3A-pOVA-H2B-Cerulean tumors in DSFCs installed on IL-12 YFP reporter mice, as recorded by MP-IVM following injection with QTracker 655 to visualize perfused blood vessels. The image is a collage of 20 individual image stacks. ROIs show representative regions illustrating the characteristic distribution of YFP+ DC3 in tumor parenchyma (ROI1) and stroma (ROI2).
(D) % of area occupied by YFP+ cells in stroma vs. parenchyma
(E) Immuno-stained sections of D4M.3A-pOVA flank tumors 3 days after i.v. injection of CD45.1+ TCF-1neg OT-I into IL-12 p40-YFP reporter mice. Magnified ROIs illustrate overlap of YFP and Fascin1 signal.
(F, G) Migratory behavior of Cxcr6−/− (Green) and WT (Red) TCF-1neg OT-I CTL in the stroma of D4M.3A-pOVA tumors visualized in DSFCs installed on IL-12 p40 YFP mice.
(G) shows DC3 (yellow), WT CTL, KO CTL, and WT and KO CTL migratory tracks (bottom) in ROIs selected for the accumulation of T cells near perivascular DC3 clusters (left) or around smaller DC3 clusters distal to venular vessels (right).
(H, I) Densities (H) and input-corrected ratios (I) of WT and Cxcr6−/− CTL proximal and distal to perivascular DC3 on day 3 (left) or days 4 and 5 (right) after CTL i.v. injection.
(J-M) Median 3D migratory velocities (J), Arrest coefficients (K), Track straightness coefficients (L), and 10-min displacement coefficients (M) of 422 WT and 182 Cxcr6−/− CTL in 4 recordings from two independently performed experiments.
Data in B, D represent two and three independent experiments with similar results. Graphs in B, D, H, and I show means and individual replicates, J-M represent medians and quartiles. */**/**** = p<0.05/0.01/0.0001.
