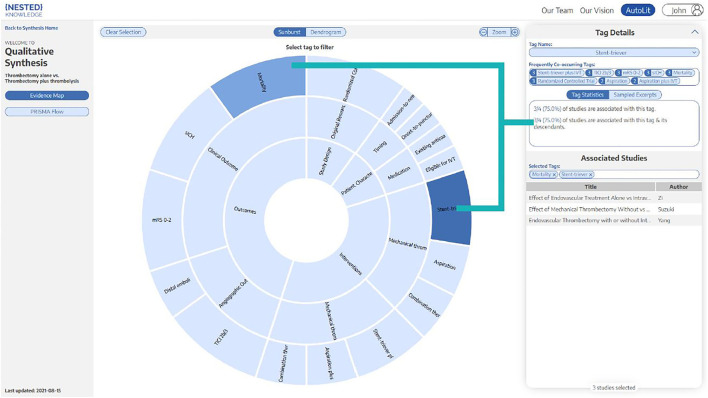
Figure 1.
Patient demographics, interventions, and outcome variables. Sunburst diagram generated by Nested Knowledge depicting the variables and treatment arms of this study, with organization hierarchy from inside to outside. For example, “Clinical Outcomes” and “Angiographic Outcomes” are two sub-categories of “Outcomes”.

