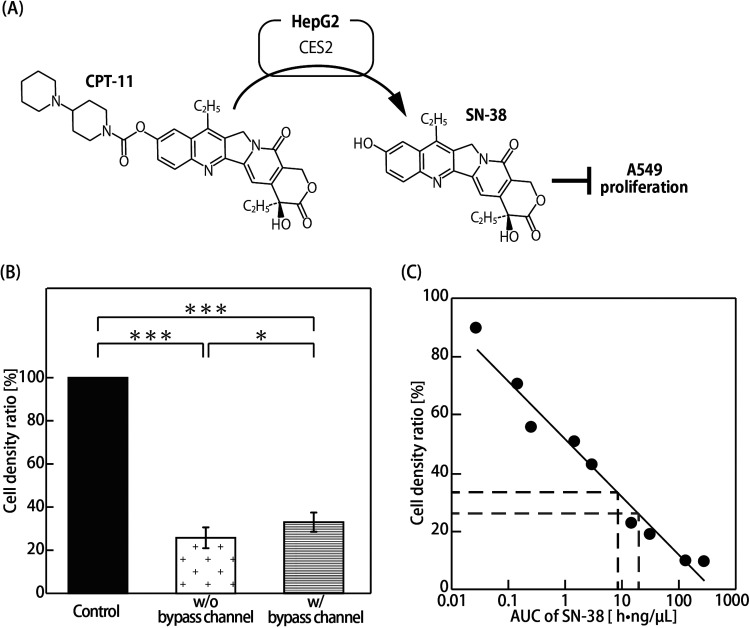
FIG. 3.
Evaluation of the drug efficacy in the MOoC. (a) Metabolic map of CPT-11 by HepG2. CPT-11 is metabolized to SN-38 by CES2. SN-38 suppresses A549 proliferation. (b) Cell density ratio of A549 in the CPT-11 assay. The cell densities are expressed as the ratio of the cell density to the cell density of the control (n = 3–6; mean ± SD). Asterisks indicate significant differences (* P < 0.05; *** P < 0.005). (c) Cell density ratio as a function of AUC of SN-38. The dark broken line indicates the result of the MOoC with the bypass channel, whereas the light broken line shows the result of the MOoC without the bypass channel.

