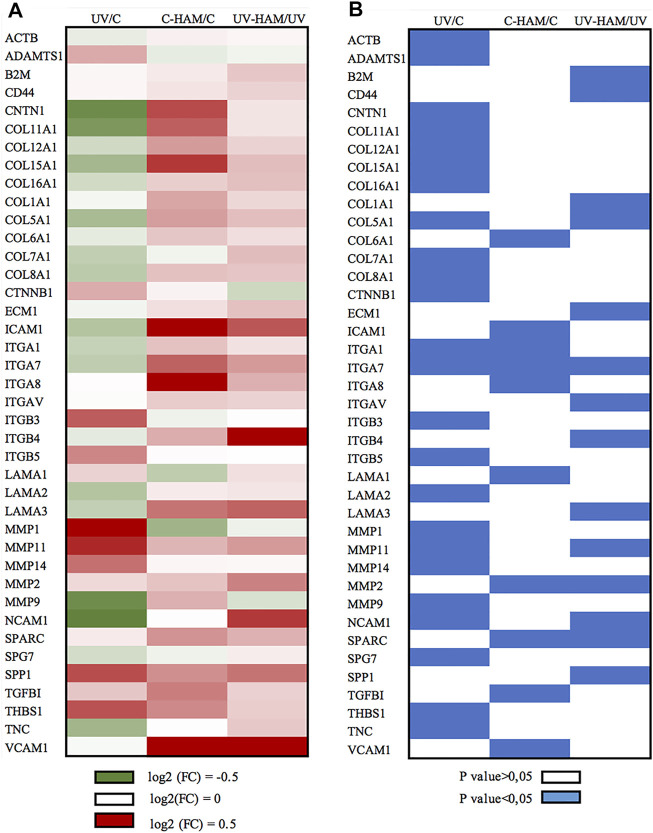
FIGURE 4.
Graphical presentation of (A) log (2) Fold Change (FC) mean of gene expression and (B) the corresponding p value evaluated by paired t-test. (A) Green cells represent the downregulation at the interval 0–0.5 log (2) FC, white cells indicate no changes and red cells represent upregulation at the interval 0–0.5 log (2) FC. (B) blue cells indicate the statistically significant genes (p < 0.05). The figure shows all the genes that are significantly regulated at least in one treatment.

