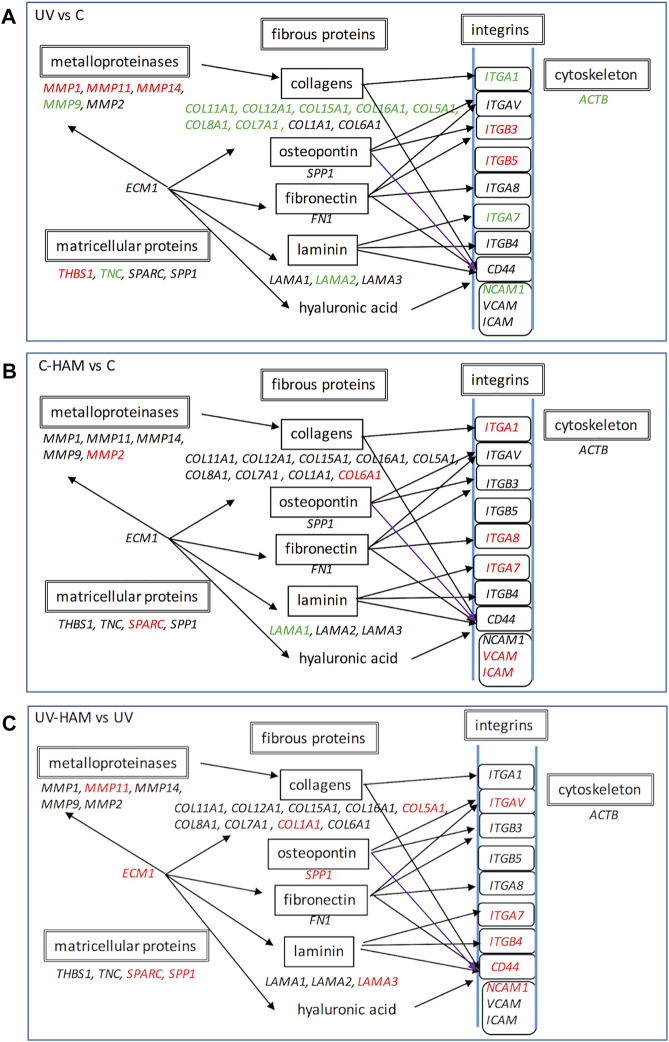
FIGURE 5.
Schematic representation of gene expression regulation of UV treatment with respect to control (A), C-HAM with respect to control (B) and UV-HAM with respect to UV treatment (C). Names in Italic font indicates genes which expression is upregulated (in red), downregulated (in green) and statistically not significant (in black). Modified by KEGG pathway (https://www.genome.jp/dbget-bin/www_bget?pathway:map04512).

