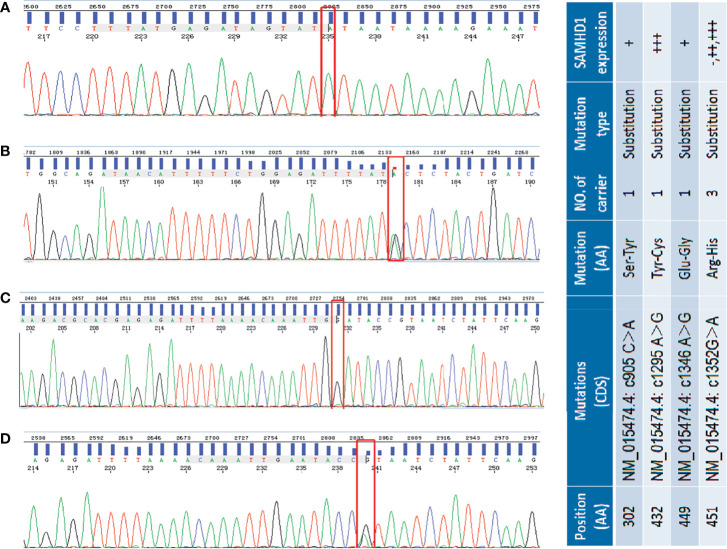
Figure 2.
Selected sequencing chromatograms of SAMHD1 using Sanger sequencing. Panel (A) shows the homogeneous c905 C>A mutation (red box highlighted) in exon 8 of SAMHD1. Panel (B) shows the heterogeneous c1295A>G transition in exon 12 of SAMHD1. In panel (C), the highlighted red box represents the homogeneous c1346G>A transition in exon 12 of SAMHD1. Panel (D) is the heterogeneous c1552G>A mutation in exon 12 of SAMHD1. The included table on the right is the correlation of SAM HD1 mutations and their expression in MCL cases.

