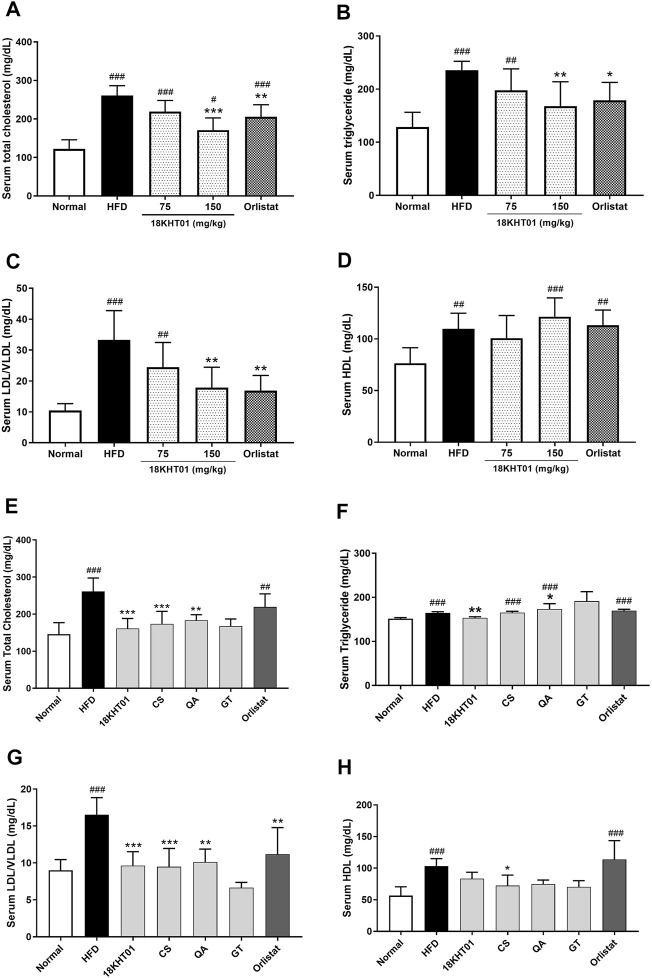
FIGURE 6.
Effect of 18KHT01 on serum lipid profile. Serums lipid profile assay was performed to measure total cholesterol (TC), triglyceride (TG), low/very low-density lipoprotein (LDL/VLDL) and high-density lipoprotein (HDL). In the anti-obesity study, (A) serum cholesterol; (B) serum triglyceride; (C) serum LDL/VLDL; and (D) serum HDL were analyzed in DIO mice. Similarly, (E) serum TC, (F) TG, (G) LDL/VLDL, and (H) HDL were analyzed in the synergy evaluation animal study. Statistical significance was calculated using one-way ANOVA followed by Dunnett’s multiple comparisons test. Values are expressed as mean ± standard deviation (n = 6) with significance #p < 0.05, ##p < 0.01, ###p < 0.001 vs Normal; *p < 0.05, **p < 0.01, ***p < 0.001 vs HFD control. Normal = Standard chow diet; HFD = high-fat diet control; Orlistat = orlistat (10 mg/kg).

