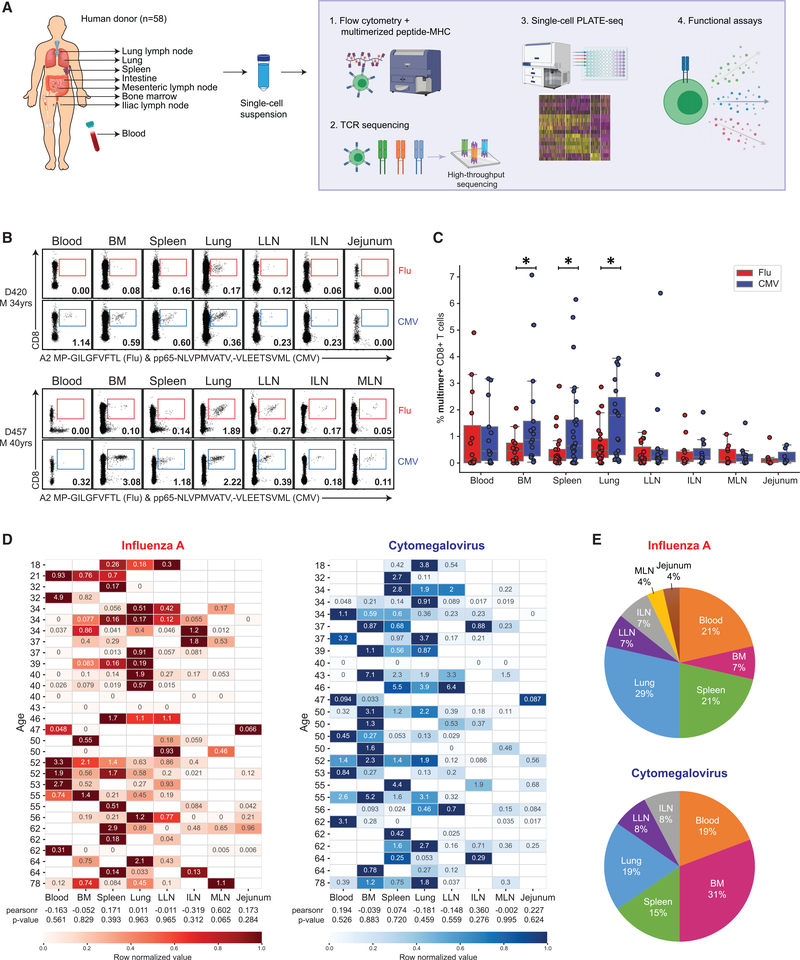
Figure 1. Differential maintenance of flu- and CMV-specific CD8+ T cells across diverse tissue sites.
(A) Schematic diagram illustrating human tissues obtained and experimental workflow for this study.
(B) Distribution of influenza A (flu)-specific (red) and cytomegalovirus (CMV)-specific (blue) CD8+ T cells in different human tissues of two representative donors (D420, top; D457, bottom) based on staining with multimer reagents containing viral epitopes shown in representative flow cytometry plots (see Figure S1 for gating strategy). Numbers indicate frequency of multimer+ cells within total CD8+ T cells.
(C) Frequencies of flu-multimer+ (red) and CMV-multimer+ (blue) CD8+ T cells from 7–27 donors for each tissue site.
(D) Heatmaps showing frequency of flu-specific (left) and CMV-specific (right) CD8+ T cells in blood and tissues sites for individual donors from which data from two or more tissues were obtained. Donors are arranged by increasing age, and color intensity of each cell is based on row normalization of (minimum to maximum [min-max] scaled) values (white cells indicate no sample). Pearson correlation analysis of age and multimer frequency is indicated by “pearsonr” correlation coefficients, and p values are listed underneath each heatmap.
(E) Pie charts showing percentage of donors for which the indicated tissue contains the greatest frequency of flu-multimer+ (top) or CMV-multimer+ (bottom) cells among the tissue sites studied for that donor.
Statistical significance for comparison of means was calculated by unpaired t test and indicated by *p ≤ 0.05. BM, bone marrow; ILN, iliac lymph node; LLN, lung draining lymph node; M, male; MLN, mesenteric lymph node.

