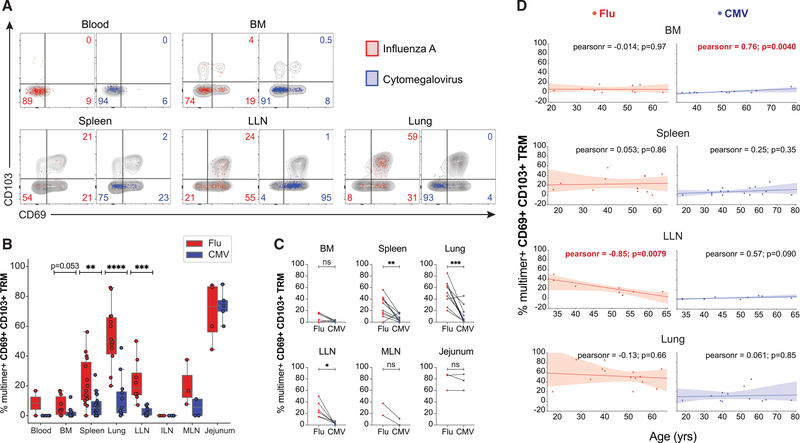
Figure 3. Establishment of tissue residency correlates with virus specificity and site.
(A) Expression of tissue residency markers CD69 and CD103 by flu-specific (red) and CMV-specific (blue) CD8+ T cells in indicated tissue sites shown in representative flow cytometry plots with gray contour plots depicting total CD8+ T cells within the same sample; numbers indicate frequency of multimer+ virus-specific cells.
(B) Frequencies of flu-multimer+ (red) and CMV-multimer+ (blue) CD69+CD103+CD8+ TRM cells gated on TEM cells from 2–18 donors for each site. Statistical significance for comparison of means was calculated by unpaired t test and indicated by ****p ≤ 0.0001; ***p ≤ 0.001; **p ≤ 0.01.
(C) Paired frequencies within individual donors of flu-multimer+ (red) and CMV-multimer+ (blue) CD69+ CD103+ CD8+ TRM cells from 2–10 donors for each site. Statistical significance between flu- and CMV-multimer+ TRM cells within each tissue site was determined by paired t test and indicated by ***p ≤ 0.001; **p ≤ 0.01; *p ≤ 0.05; ns, not significant.
(D) Frequencies of flu-specific (red, left) and CMV-specific (blue, right) TRM cells in indicated tissue sites as a function of age for each individual donor. The line of best fit, Pearson coefficient, and p value are indicated for each comparison; red font indicates significant correlation for LLN. TRM cell frequencies shown from donors with ≥5 multimer+ TEM cells.

