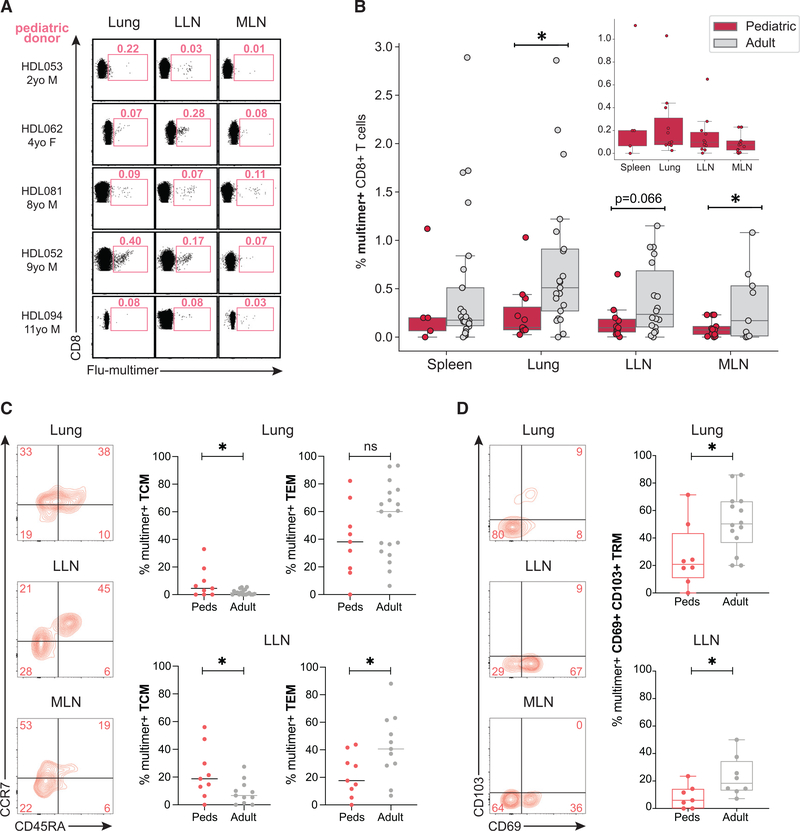
Figure 4. Distinct frequencies and subset distribution of flu-specific memory CD8+ T cells between adult and pediatric donors.
(A) Distribution of flu-specific CD8+ T cells in lung, LLN, and MLN of pediatric and adult donors shown in representative flow cytometry plots. Numbers indicate frequency of multimer+ cells within total CD8+ T cell population.
(B) Frequencies of flu-multimer+ CD8+ T cells in pediatric (pink; n = 15) and adult (gray; n = 31) donors from 5–21 donors for each tissue site. Inset shows frequencies of flu-multimer+ cells in pediatric tissues with y axis spanning 0%–1%.
(C) Memory T cell subset distribution of flu-specific CD8+ T cells in indicated tissues of pediatric donors shown in representative flow cytometry plots (left) and compiled in graph (right) showing frequencies of flu-multimer+ CD8+ T cells in pediatric (pink) and adult (gray) donors maintained as TCM (left) and TEM (right) in lung (top) and LLN (bottom) tissue sites. Subset frequencies shown from donors with ≥10 multimer+ T cells.
(D) Expression of tissue residency markers CD69 and CD103 by flu-specific CD8+ T cells in indicated tissues of pediatric donors shown in representative flow cytometry plots (left) and compiled in graph (right) showing frequencies of flu-multimer+ CD69+CD103+CD8+ TRM cells (gated on TEM) in pediatric (pink) and adult (gray) donors in lung (top) and LLN (bottom) tissue sites. TRM frequencies shown from donors with ≥5 multimer+ TEM cells.
Statistical significance for comparison of means was calculated by unpaired t test and indicated by *p ≤ 0.05; ns, not significant.

