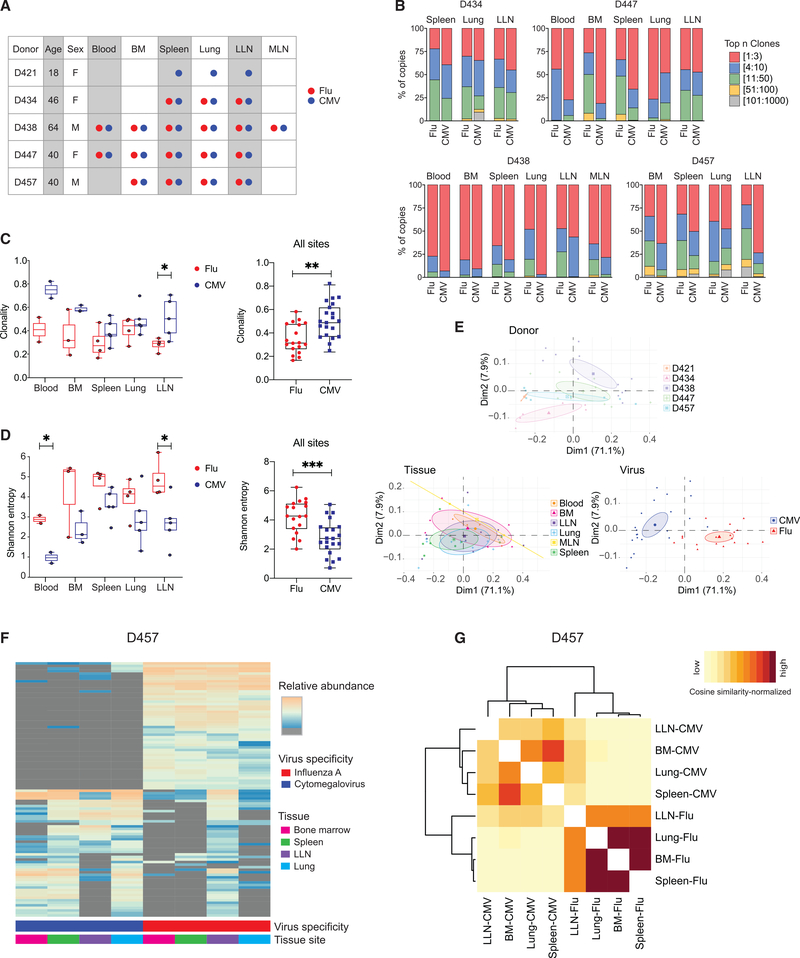
Figure 6. CD8+ T cell clonal distribution and diversity are shaped by virus specificity.
(A) Diagram showing donor, tissue, and virus specificity of samples for T cell receptor (TCR) sequencing. flu-multimer+ (red), CMV-multimer+ (blue), and total (gray) CD8+ T cells were sorted from indicated tissue sites of five organ donors.
(B) Clonal abundance plots showing proportion of top n clones per sample for flu- and CMV-specific CD8+ T cells from indicated tissue sites for donors D434 (top left), D447 (top right), D438 (bottom left), and D457 (bottom right).
(C and D) TCR clonality (C; see STAR Methods) and Shannon entropy (D; see STAR Methods) by virus specificity for flu-specific (red) and CMV-specific (blue) CD8+ T cell clones stratified by tissue site (left) and in all tissue sites combined (right).
(E) Principal-component analysis (PCA) of TRBV gene usage based on clone counts per sample, labeled and grouped by donor, tissue, and virus with confidence ellipses plotted around group mean points using the factoextra R package.
(F) Sharing of flu- and CMV-specific CD8+ T cells between indicated sites of donor D457 shown in clone tracking plots with each individual clone denoted by a line shaded by relative abundance within a tissue site.
(G) Cosine similarity between pairwise cell populations of flu- and CMV-specific CD8+ T cell clones in BM, LLN, lung, and spleen of donor D457. Color intensity of each cell is based on the normalization of (min-max scaled) values of sequenced samples.
Statistical significance for comparison of means was calculated by unpaired t test and indicated by ***p ≤ 0.001; **p ≤ 0.01; *p ≤ 0.05.

