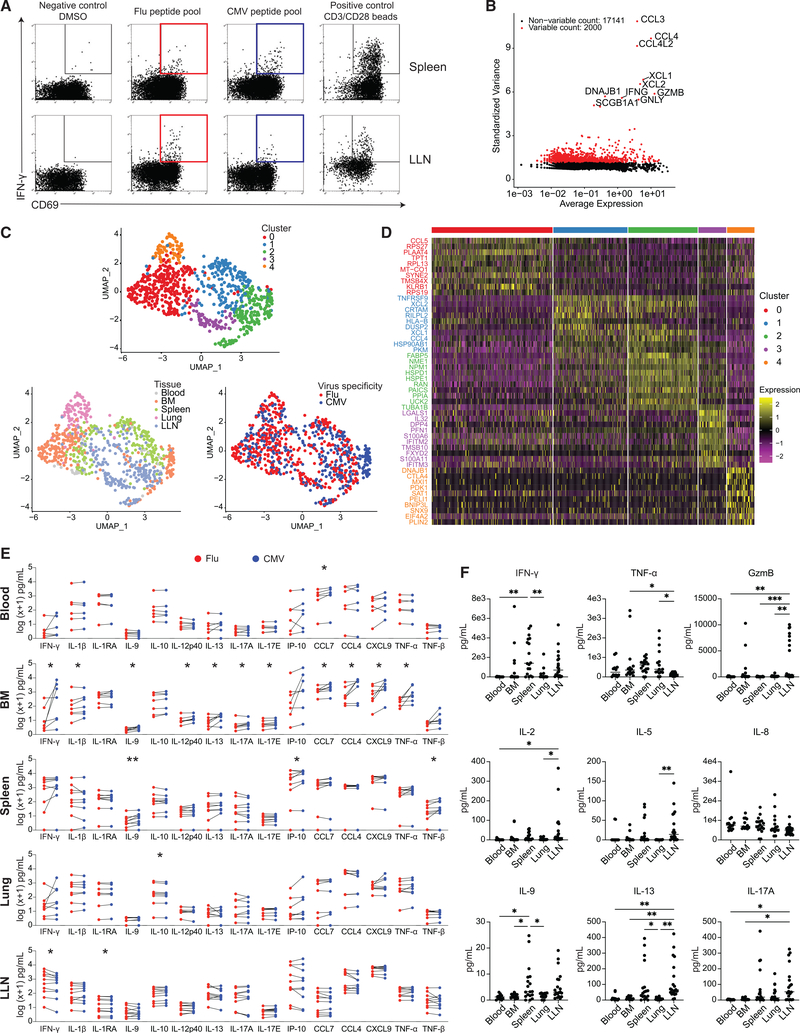
Figure 7. Tissue segregation of the anti-viral T cell response revealed by single-cell transcriptome and functional profiling.
(A) Antigen-responding CD69+IFN-γ+CD8+ T cells in the spleen and LLN of donor D481 following stimulation by DMSO negative control, flu antigen-specific peptide pool, CMV antigen-specific peptide pool, and anti-CD3/CD28 bead positive control, shown in representative flow cytometry plots. Colored gates (red: flu; blue: CMV) indicate populations that were subsequently sorted for sequencing.
(B) Scatterplot showing 2,000 variable genes (red) as determined by calculating average expression and dispersion of each gene. The top 10 most highly variable genes are labeled on the graph.
(C) UMAP embedding of virus-reactive CD8+ T cells colored by cluster as identified via unsupervised hierarchical clustering (see STAR Methods), tissue, or virus specificity.
(D) Heatmap showing top 10 most differentially expressed genes in each cluster. See Table S4 for complete list of differentially expressed genes (padj < 0.1).
(E) Pairwise comparisons of log(x+1) normalized cytokine levels in supernatants from in vitro stimulation of single-cell suspensions from blood (n = 6), BM (n = 7), spleen (n = 9), lung (n = 8), and LLN (n = 10) with flu (red) or CMV (blue) peptide pools. Statistical significance between flu- and CMV-stimulated conditions was calculated by paired t test and indicated by **p ≤ 0.01; *p ≤ 0.05.
(F) Cytokine levels in blood, BM, spleen, lung, and LLN supernatant samples.
Statistical significance was calculated using one-way ANOVA followed by Tukey’s multiple comparisons test indicated by ***p ≤ 0.001; **p ≤ 0.01; *p ≤ 0.05.

