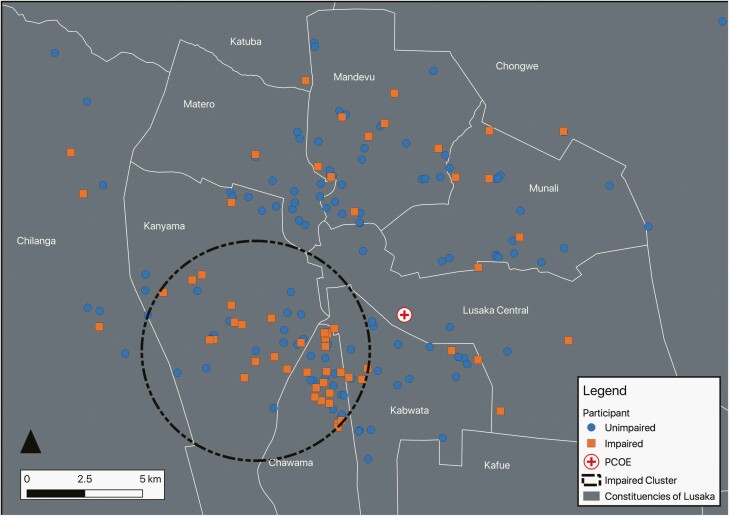
Figure 2.
Geographic clustering of cognitively impaired Zambian participants with HIV. This figure shows a 4.92-km-radius cluster of cognitively impaired participants with HIV. The prevalence of cognitive impairment among participants with HIV in this region was 52.2%, compared with the 34% of participants who were cognitively impaired over the entire geographic area. The cluster had an observed/expected ratio of 1.50, a log-likelihood ratio of 6.85, and a P-value of .128. Created on December 31, 2020—EPSG:20934 Arc 1950/UTM Zone 34S—Stanford Earthworks, Google Maps, OpenStreetMap, Central Statistical Office of Zambia. The color version of this figure is available in the online edition.

