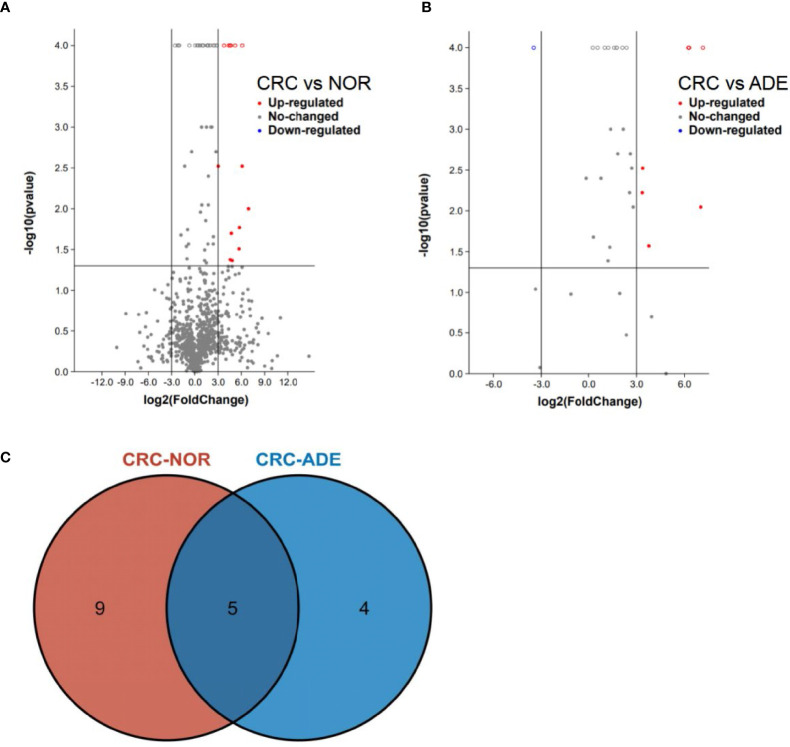
Figure 1.
gutMEGA database analysis. (A) The volcano chart shows that the species level of colorectal cancer is compared with the normal human intestinal flora, and the species level meets the conditions of Log2(colorectal cancer/NOR) > 3, P < 0.05. (B) The volcano chart shows that the species level of colorectal cancer patients meets the conditions of Log2(colorectal cancer/ADE) > 3, P < 0.05 compared with those with adenoma. (C) The Venn diagram shows the analysis results of the gutMEGA database. ADE, adenoma; NOR, normal person.

