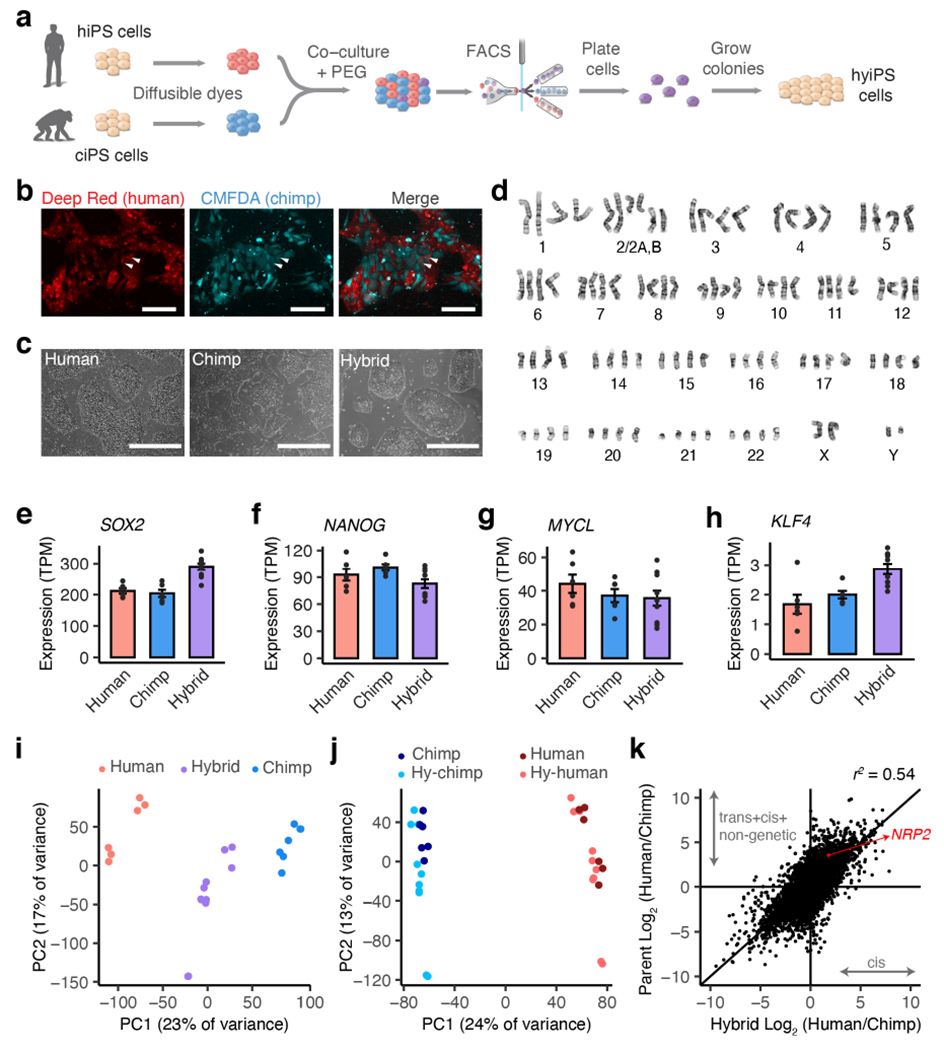
Figure 1 |. Generation of human-chimpanzee hybrid iPS cells.

a, Generation of hybrid iPS cells. b, Fluorescent imaging of co-cultured human (H20961) and chimpanzee (C3649) iPS cells; arrows indicate putative hybrid cells; experiment was reproduced for 2 pairs of fusion cell lines to generate 5 hybrid cell lines. c, Bright field images of human (H20682), chimpanzee (C3649) and hybrid (Hy1-29) iPS cell colonies in feeder-free conditions; n= 3 human, 3 chimpanzee and 5 hybrid cell lines were cultured in this study. d, Representative karyotype for male (XY/XY) hybrid iPS cell lines. e-h, Gene expression (TPM, transcripts per million) for pluripotency markers SOX2, NANOG, MYCL, and KLF4 in human (n= 3 iPS cell lines, 2 replicates each), chimpanzee (n= 3 iPS cell lines, 2 replicates each) and hybrid (n= 5 iPS cell lines, 2 replicates each); error bars, mean ± s.e.m. i-j, Principal components plot for RNA-seq samples based on total gene expression (i) or allelic gene expression (j). k, Scatter plot showing differences in gene expression between parent cell lines (y-axis) versus between alleles in the hybrid cells (x-axis); data are from bulk RNA-seq of 3 human, 3 chimpanzee and 5 hybrid iPS cell lines, all with 2 replicates each. Scale bars, 100 μm (b), 400 μm (c).
