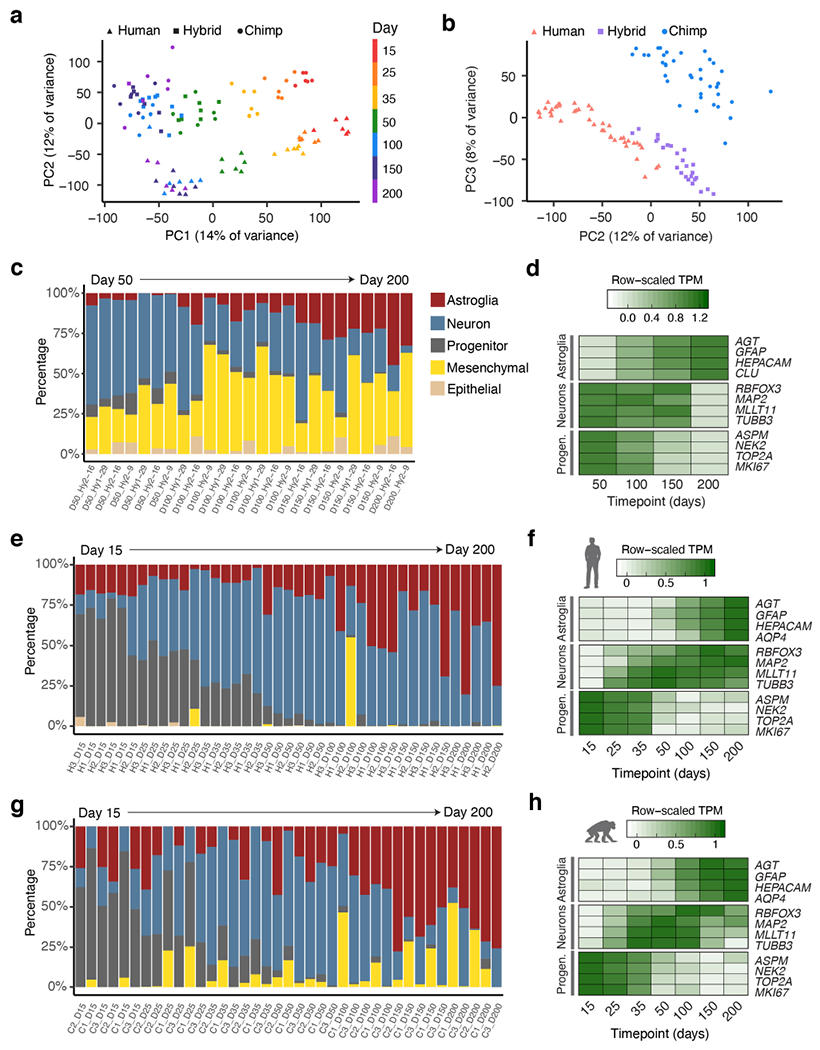
Extended Data Figure 7 |. RNA-seq and cell type deconvolution in cortical spheroids.

a-b, Principal components plots for RNA-seq samples based on total gene expression of parent and hybrid samples. c, e, g, Per-sample estimated cell type proportions in hyCS (c), hCS (e) and cCS (g) (see Methods). d, f, h, Normalized expression across time of cell-type specific marker genes in hyCS (d), hCS (f) and cCS (h); TPM, transcripts per million.
