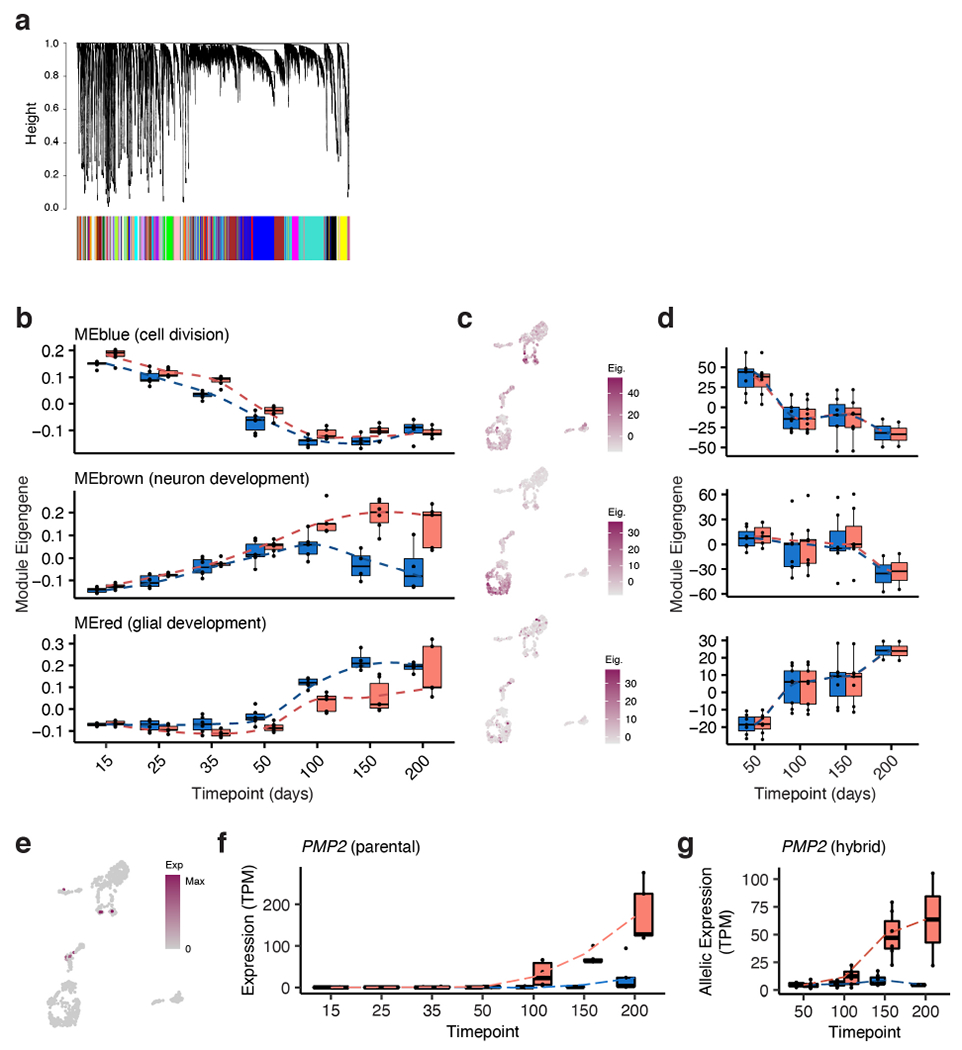
Extended Data Figure 8 |. Weighted gene co-expression network analysis.

a, Dendrogram of all genes used in WGCNA; genes in the same color block belong to the same co-expressed module. b, Eigengene values for genes in the Blue, Brown and Red modules over time in hCS and cCS; chimpanzee blue, human red; in order of time points, n= 6, 6, 6, 6, 6, 6, 5 hCS and n= 6, 6, 6, 6, 5, 5, 5 cCS samples from 3 human and 3 chimpanzee iPS cell lines (1-2 replicates per cell line). c, Expression of module genes (eigengene, see Methods) in single cell data; cell clusters are defined in Extended Data Fig. 5a. d, Allelic eigengene values for genes in these modules over time in hyCS (see Methods); chimpanzee blue, human red; n as in (b). e, Single cell gene expression of PMP2. f, Expression of PMP2 in parental bulk time course; chimpanzee blue, human red; n as in (b). g, Allelic expression of PMP2 in hybrid bulk time course; chimpanzee allele blue, human allele red; n as in (b). Box plots in (b, d, f, g): center line, median; box limits, upper and lower quartiles; whiskers, 1.5x interquartile range, dotted lines connect average values.
