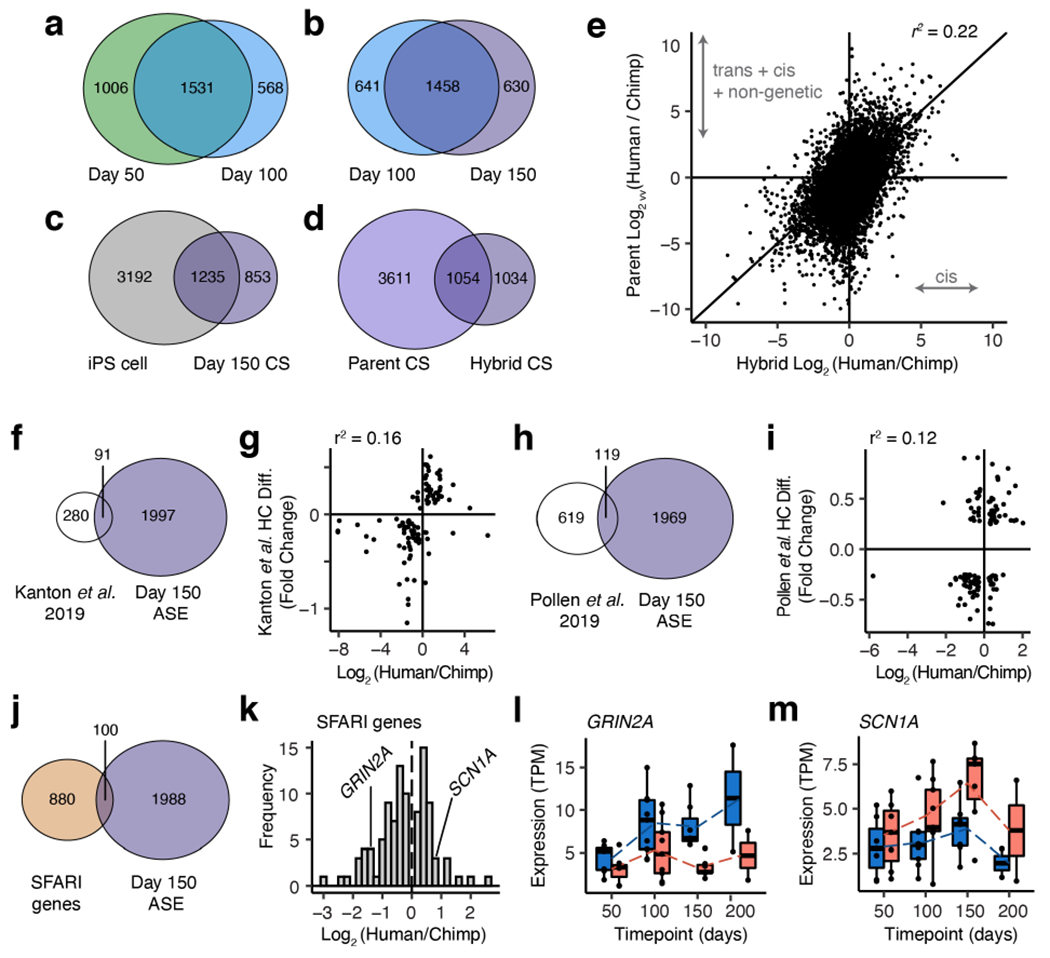
Extended Data Figure 9 |. Summary of ASE genes.

a-d, Overlap in genes with significant ASE (a,b,c; d hybrid) or differential expression (d parent) across bulk data sets; data in (d) are from day 150. e, Scatter plot showing differences in gene expression between parent lines (y-axis) versus between alleles in the hybrid (x-axis) at day 150; data are from bulk RNA-seq of 6 human, 5 chimpanzee and 7 hybrid CS samples, collected across 3 human, 3 chimpanzee and 3 hybrid iPS cell lines. f, Overlap between ASE genes and SFARI genes. g, ASE in SFARI genes from the overlapping genes in (f). h-i, Allelic expression (TPM, transcripts per million) over time in GRIN2A and SCN1A; human allele pink, chimpanzee allele blue; in order of time points n= 7, 9, 7, 2 hyCS samples (1-2 spheroids per sample) from 3 independent differentiations of 3 hyiPS cell lines. j, Filtering pipeline for prioritizing candidate genes. k, Scatter plot of hybrid ASE (x-axis) and parental differential expression (y-axis) for top candidate genes at day 150; n= 7 hyCS, 6 hCS, and 5 cCS samples (1-3 spheroids per sample) derived from 3 iPS cell lines per species and 2 independent differentiations per hiPS and ciPS cell line, n= 3 independent differentiations per hyiPS cell line. Box plots in (h, i): center line, median; box limits, upper and lower quartiles; whiskers, 1.5x interquartile range; dotted lines connect average values.
