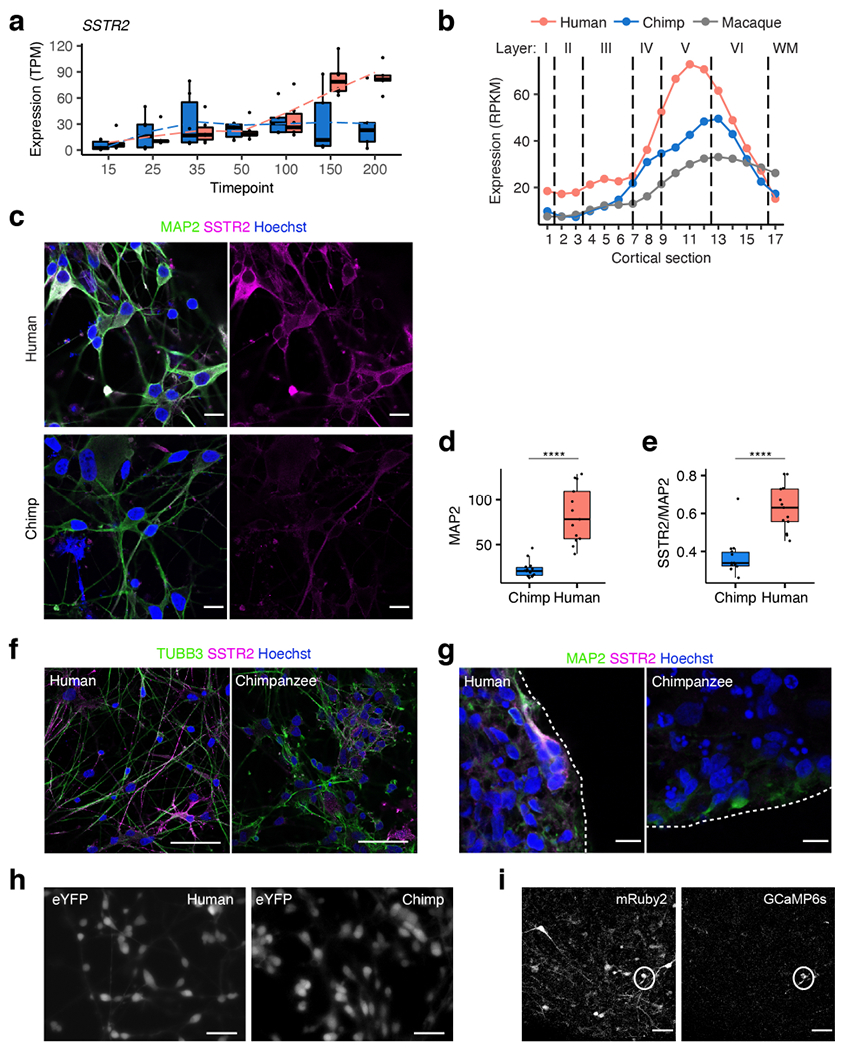
Extended Data Figure 10 |. Validation of SSTR2.

a, Expression of SSTR2 in parental bulk time course; chimpanzee blue, human red; in order of time points, n= 6, 6, 6, 6, 6, 6, 5 hCS and n= 6, 6, 6, 6, 5, 5, 5 cCS samples from 3 human and 3 chimpanzee iPS cell lines (1-2 replicates per cell line). b, Expression of SSTR2 across cortical sections in adult primate brain tissue (data from He et al.38); dotted lines indicate approximate boundaries of cortical layers; WM, white matter. c, Immunostaining for MAP2 (neuronal) and SSTR2 protein in dissociated hCS (H20682) and cCS (C3649) at day 225-250; right panels show SSTR2 only; 10 images were taken per sample and quantified. d, Quantification of fluorescence intensity (arbitrary units) of MAP2 for the images in (c); n= 13 cells for hCS, 14 cells for cCS; **** P<0.0001, two-tailed Mann-Whitney test. e, Quantification of fluorescence intensity (arbitrary units) of SSTR2 relative to MAP2 for the images in (c); n= 13 cells for hCS, 14 cells for cCS; **** P<0.0001, two-tailed Mann-Whitney test. f, Additional immunostaining for TUBB3 (neuronal) and SSTR2 in dissociated hCS (H20682) and cCS (C3649) at day 225-250; 10 images were taken per sample and quantified. g, Immunostaining for MAP2 and SSTR2 in whole hCS (H20961) and cCS (C3651) at day 160; imaging was reproduced across 3 human and two chimpanzee cell lines from one differentiation experiment with n= 3, 2, 3, 2, 3 images for lines H21792, H20682, H20961, C3649 and C3651, respectively. h, Representative still frame images of hCS (H20682) and cCS (C3649) derived neurons infected with AAV-DJ-hSyn1-eYFP; images are taken from one of the samples in Fig 4g-i; experiment was reproduced across 2 human and 1 chimpanzee cell line. i, Representative still frame images of hCS (H20682) infected with the viral vector co-encoding stable red fluorophore mRuby2 and genetically encoded calcium indicator GCaMP6s; images are taken from one of the samples in Fig. 4j-l; experiment was reproduced across 3 human and 3 chimpanzee cell lines. Box plots in (a, d, e): center line, median; box limits, upper and lower quartiles; whiskers, 1.5x interquartile range; dotted lines connect average values (a). Scale bars, 50 μm (f), 10 μm (c, g), 60 μm (h), 30 μm (i).
