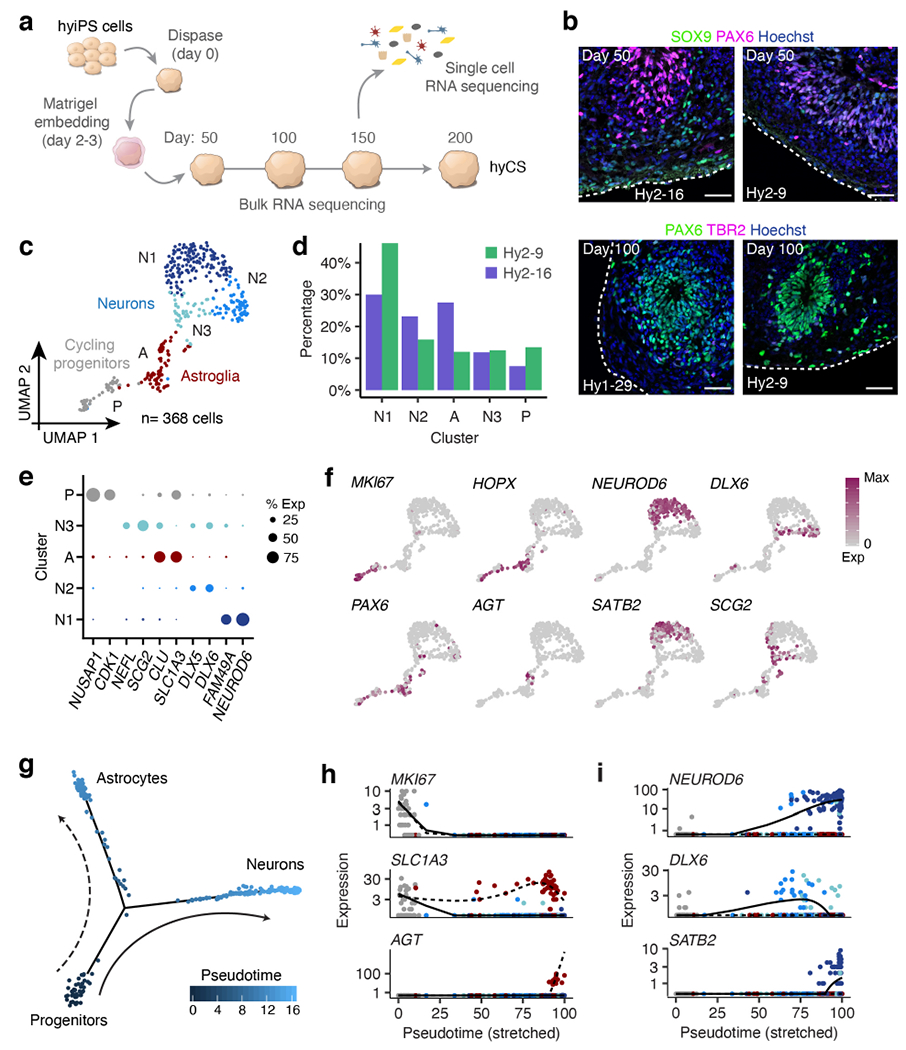
Figure 2 |. Cortical differentiation of hybrid iPS cells.

a, Generation of CS from hybrid iPS cells. b, Immunostaining of hyCS for SOX9, PAX6 and TBR2; at each time point, a maximum of 2 spheroids were fixed for immunostaining across n= 3 hybrid cell lines with n= 3 independent differentiation experiments per cell line. c, UMAP clustering of all neural cells (n= 368); clusters are identified by color and labelled by letter (A= astroglia, P= cycling progenitors, N1= glutamatergic neurons, N2= GABAergic neurons cluster 1, N3= GABAergic neurons cluster 2). d, Proportion of CS cells from each hybrid cell line in each single cell cluster (from c). e, Dotplot for expression of marker genes for each cluster in (c), size corresponds to the percent of cells in each cluster that express each gene. f, UMAP colored by expression of marker genes. g, Cell trajectory map of neural cells (n= 349) colored by pseudotime. h-i, Branch-specific expression of marker genes over pseudotime for glial cells (h) and neurons (i), colored by cell type as in (c); solid and dashed lines correspond to those in (g); lines are natural spline curves for each lineage over scaled pseudotime. Scale bars, 50 μm (b).
