
Extended Data Figure 1 |. Isolation and characterization of hyiPS cells.
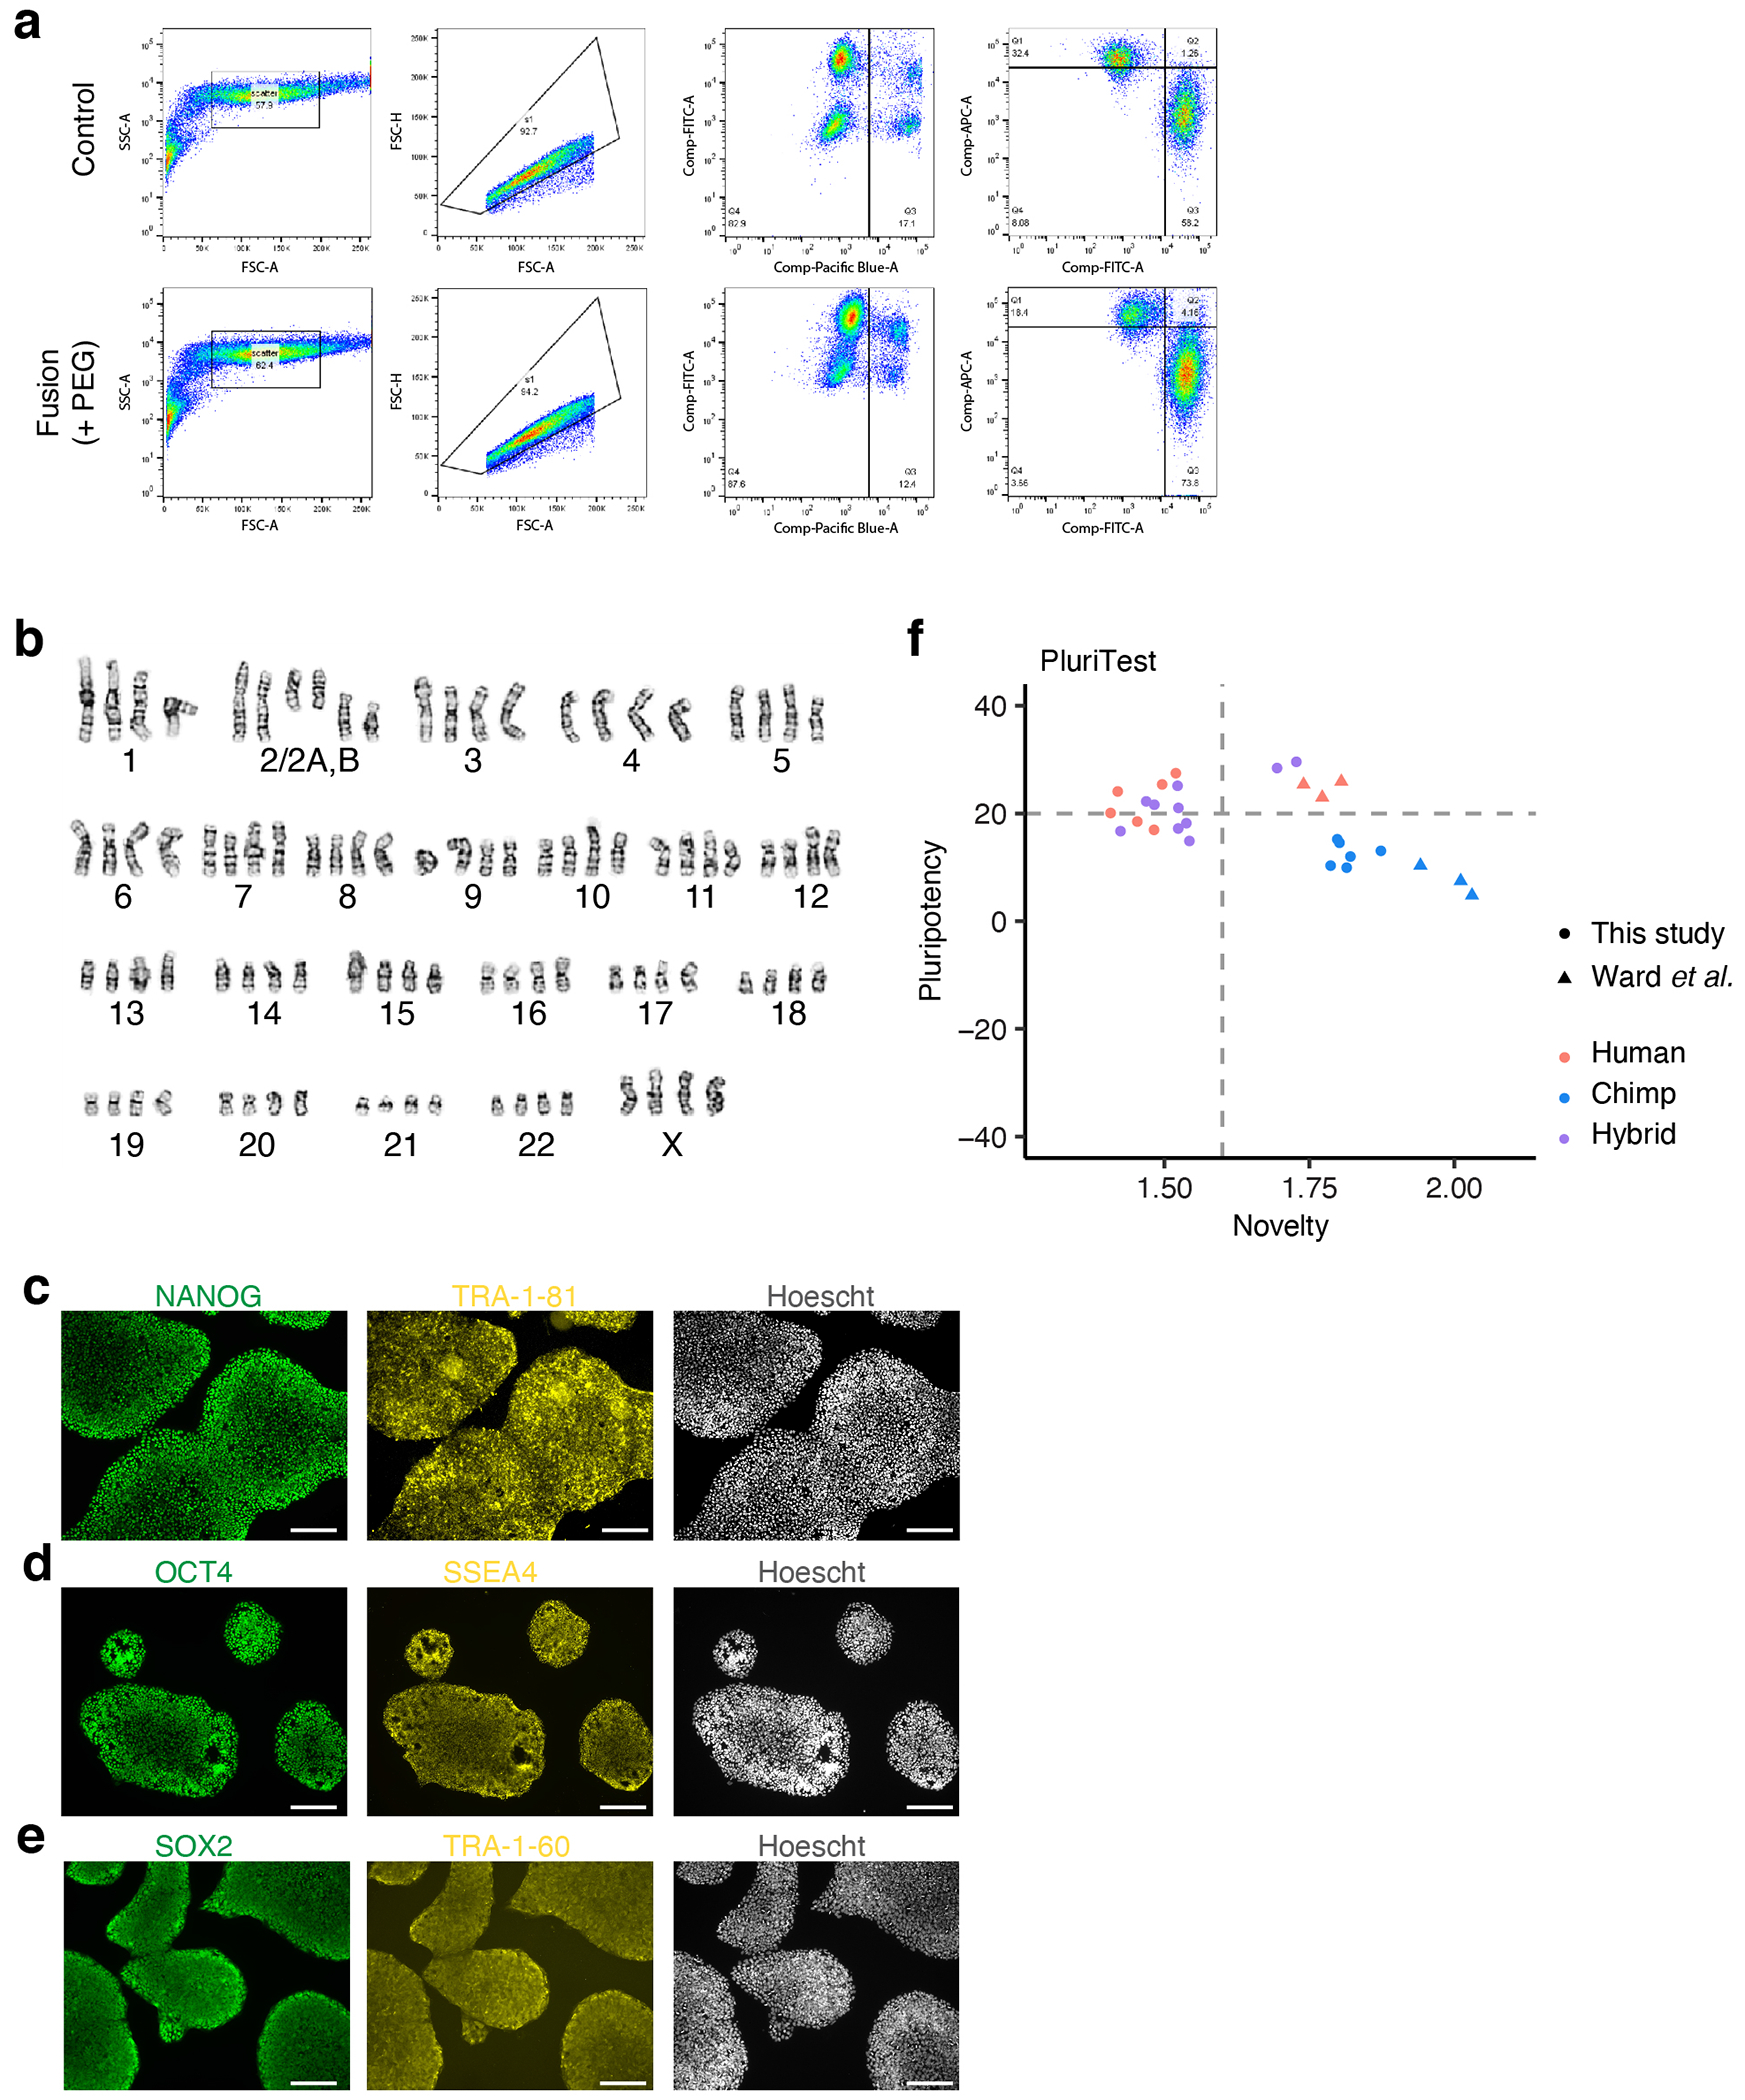
a, Fluorescence-activated cell sorting (FACS) of fused hybrid cells (representative plots for fusion of H20961 and C3649); top panel, co-cultured cells with no PEG; bottom panel, co-cultured cells with PEG; from left: initial size selection, gating out doublets, gating out dead cells, sorting for red (human) and green (chimpanzee) double positive population; FSC forward scatter, SSC side scatter, -A area, -H height; Pacific Blue measures DAPI, FITC measures Green CMFDA (chimpanzee), and APC measures Deep Red (human). b, Representative karyotype for female (XX/XX) hybrid iPS cell lines. c-e, Immunostaining for the pluripotency markers NANOG, Tra-1-81 (c), OCT4, SSEA4 (d), SOX2, Tra-1-60 (e). f, Results from PluriTest analysis of RNA-sequencing data from this study and from Ward et al.10 (see Methods); benchmarked thresholds are 20 or higher for pluripotency, 1.6 or lower for novelty (dotted lines). Scale bars, 200 μm (c-e).