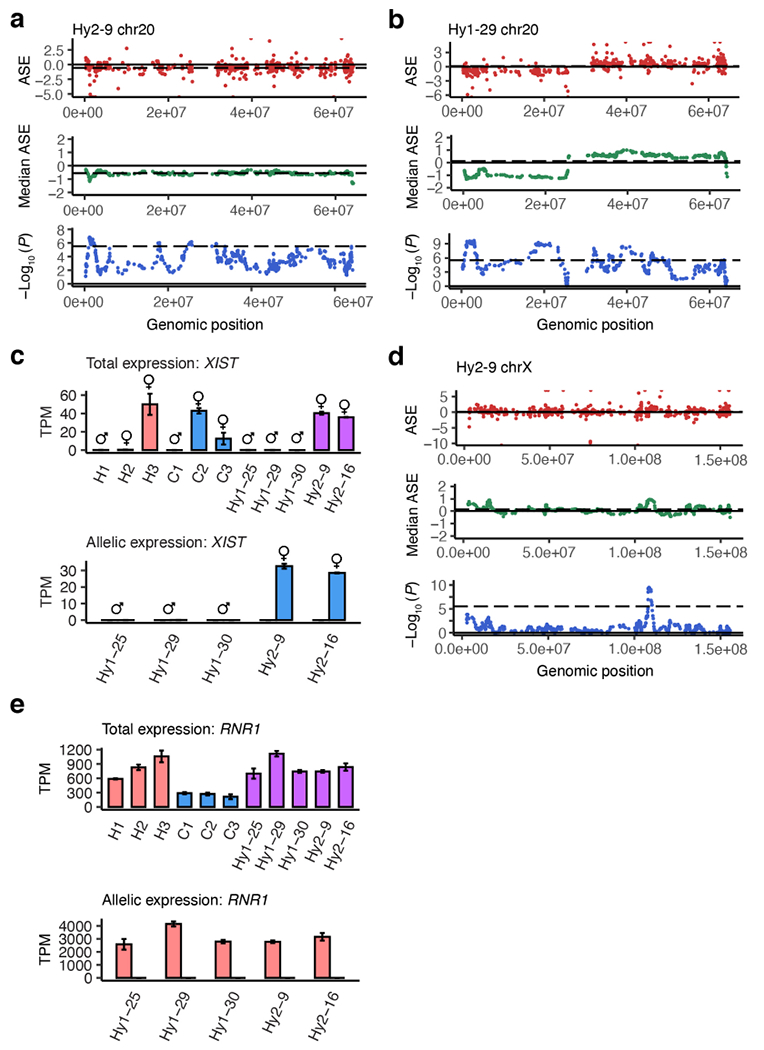
Extended Data Figure 2 |. Chromosomal instability and X chromosome inactivation.

a-b, Plots showing aneuploidies on chromosome 20 indicating a gain of a chimpanzee chromosome (a) or a combined loss of the human short arm and gain of the human long arm (b); top panel, scatter plot of allele specific expression (ASE = log2[human/chimpanzee]) versus genomic location; middle panel, median ASE in a sliding window of 20 genes; bottom panel, P-values from a two-sided Wilcoxon rank sum test comparing a sliding window of 20 genes to the background of the entire genome. c, Total (top panel) and allelic (bottom panel; human allele pink, chimpanzee allele blue) expression (TPM, transcripts per million) of XIST in RNA-seq samples; symbols indicate the sex of each iPS cell line; n= 2 technical replicates per cell line. d, Plots of ASE across the X chromosome (as in a-b). e, Total and allelic expression of RNR1 (chrMT), as in (c); n= 2 technical replicates per cell line.
