
Extended Data Figure 4 |. Generation and characterization of hyCS.
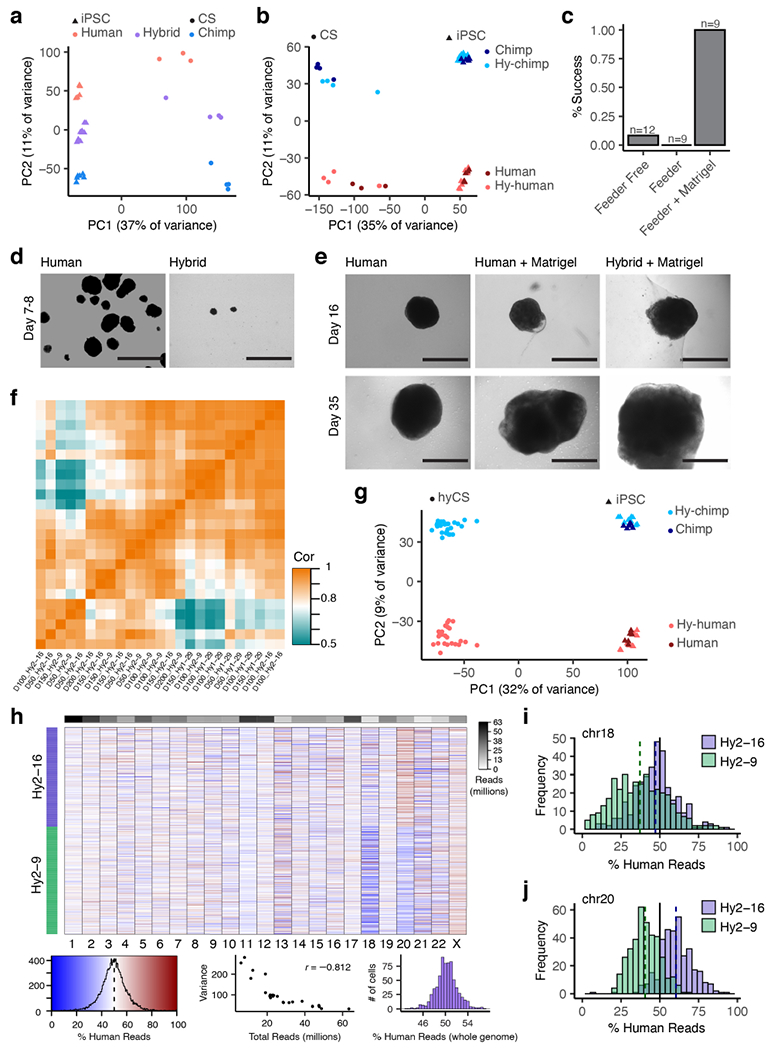
a-b, Principal components plots for iPS and CS (pilot study) RNA-seq samples based on total (a) or allelic gene expression (b). c, Rates of success of three protocols used to derive hyCS (success is defined as at least one CS from a given cell line surviving to 100 days of differentiation); n refers to the number of independent attempts to differentiate any of 3 hyiPS cell lines. d, Bright field imaging of hCS and hyCS at day 7-8 of differentiation; experiment was repeated across 3 independent differentiation experiments of 3 hyiPS and 1 hiPS cell line with similar results. e, Bright field images of Matrigel™-embedded hCS and hyCS, as well as non-embedded hCS, at days 16 and 35 of differentiation. f, Heatmap of correlations (Pearson’s) between bulk RNA-seq samples for hyCS. g, Principal components plot for iPS and hyCS (full data set) RNA-seq samples based on allelic gene expression h, Heatmap colored by the percentage of human reads in each single cell, stratified by chromosome; rows are ordered by hybrid cell line; top bar shows read depth of each chromosome across all cells; bottom left, color key and histogram for heatmap values; bottom middle, scatter plot of total read depth versus variance per chromosome, wherein fewer reads results in higher variance; bottom right, histogram showing the percent of human reads in each cell, genome-wide. i-j, Histogram of the percentage of human reads in each cell for aneuploid chromosomes 18 (i) and 20 (j), stratified by cell line. Scale bars, 1 mm (d-e).