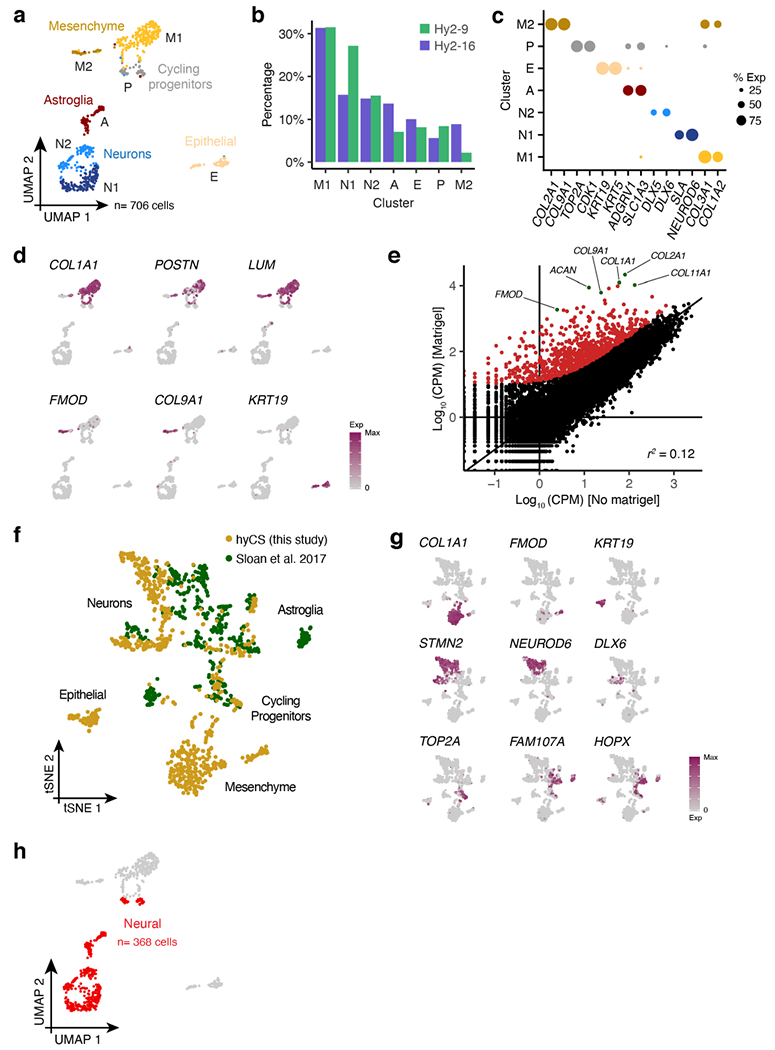
Extended Data Figure 5 |. Single cell gene profiling of hyCS.

a, UMAP clustering of all cells (n= 706); clusters are identified by color and labelled by letter (A= astroglia, P= cycling progenitors, N1= glutamatergic neurons, N2= GABAergic neurons, M1= mesenchyme cluster 1, M2= mesenchyme cluster 2, E= epithelial cells). b, Proportion of cells from each hybrid cell line in each single cell cluster (from a). c, Dotplot for expression of marker genes for each cluster in (a), size corresponds to the percent of cells in each cluster that express each gene. d, UMAP colored by expression of mesenchymal and epithelial marker genes. e, Scatter plot of normalized gene expression between embedded (y-axis) and non-embedded (x-axis) hybrid (line Hy1-29) CS at day 50 of differentiation; points in red and green indicate genes whose expression is induced by the addition of Matrigel™ (see Methods). f, tSNE of all single cells from this study aggregated with cells from non-embedded spheroids in Sloan et al.15, colored by study. g, tSNE from (f) colored by expression of cell-type marker genes. h, UMAP from (a) colored according to which cells were defined as neural and used for further analysis in Fig. 3. i, Histograms of per-gene ASE, where ASE is defined as the ratio of all human reads across cells of a given cell type to all chimpanzee reads in those cells.
