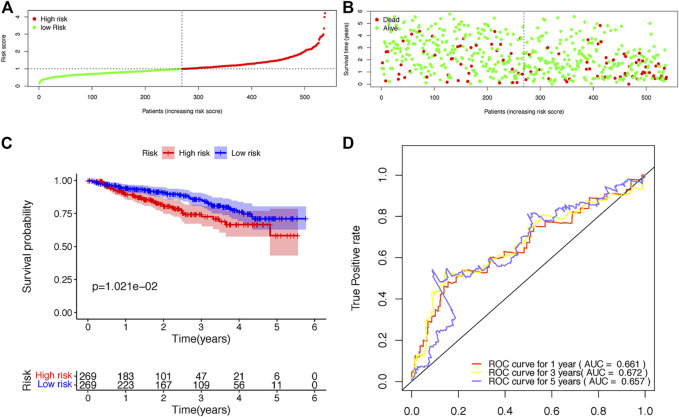
FIGURE 5.
Validation of the risk score model based on the prognostic B-cell specific RBP signature in MM. (A). Patient distribution by different risk scores in the validation set. (B). Survival status of all patients in the validation set. (C). Kaplan-Meier survival curves of patients in the high-risk and low-risk groups. (D). ROC curve analysis according to the 1–5 years survival of the area under the ROC curve value in the validation set.

