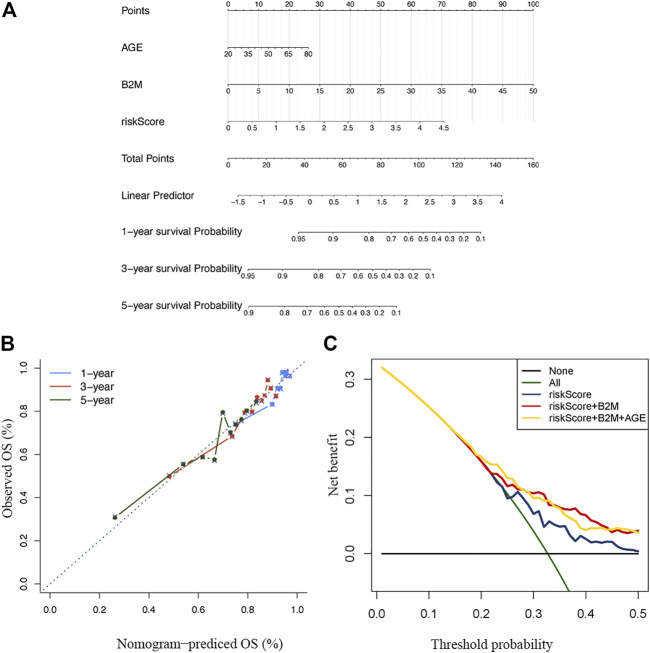
FIGURE 7.
Construction and verification of the nomogram (A) A nomogram combining clinical signatures and prognostic factors to predict the 1–5 years survival rate of MM patients (B) The 5 years calibration chart verifies the predictive ability of the nomogram (C) The 5 years decision curve analysis of the clinical benefit rate.

