Figure 4.
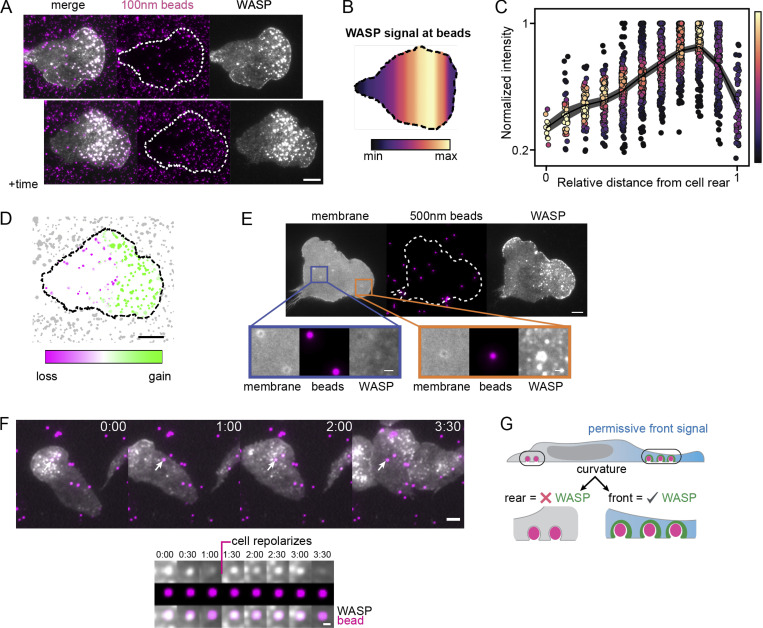
WASP recruitment depends on both curvature and cell front signals. (A) WASP enriches to bead-induced membrane deformations only in the front half of cells. Beads that have signal in the top montage lose signal as they move toward the cell rear. Images are ∼5 min apart. (B) Spatial distribution of average WASP signal from ∼135 beads that traverse the cell length. Data were collected across three experiments. The average WASP signal at a bead peaks in the front 20%–40% of the cell and then falls off despite continued presence of the bead under the cell. (C) Normalized traces of integrated WASP signal as a function of distance from the cell rear for the data in B. (D) Comparison of WASP signal gain and loss at beads from time point data in A. Beads at the cell front gain WASP (green), while beads at the cell rear lose WASP (magenta). (E) Membrane labeling (CAAX-tagBFP) confirms that beads continue to deform the membrane as they approach the cell rear yet no longer recruit WASP. Orange inset shows a bead at the front that deforms the membrane and recruits WASP, while the purple inset shows beads at the cell rear that deform the membrane but do not recruit WASP. Scale bar of the inset is 1 μm. (F) WASP signal diminishes as beads leave the front half of the cell, but reenriches at beads when front signals return. An example 200-nm bead is marked with an arrow and followed in the image series below. Scale bar of the inset is 1 μm. (G) Updated model to reflect that WASP requires both membrane curvature and front-localized signals for its enrichment. Scale bars are 5 μm unless otherwise specified. max, maximum; min, minimum.

