Figure S5.
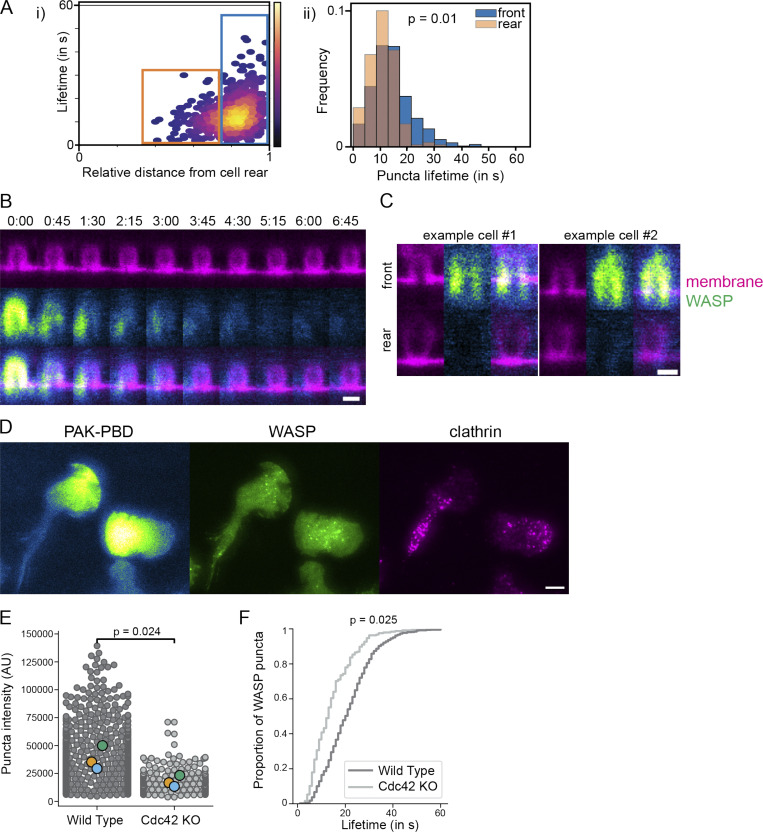
Cell front signals underlie WASP puncta localization and dynamics. (A) i: Scatter plot comparing the position of puncta appearance with lifetime reveals two populations (boxed). ii: Histograms of the boxed populations show puncta that appear closer to the cell rear extinguish faster (orange bars), suggesting that position within the cell influences puncta disappearance. More than 650 puncta were collected across 26 cells from three experiments. Mean lifetime is 14.3 ± 0.9 s for puncta that nucleate in the front 25% of the cell (blue box, n = 486 puncta) and 10.6 ± 0.25 s for puncta that nucleate farther back (orange box, n = 172 puncta). P = 0.01 by a paired two-tailed t test on replicate means. (B) Time-lapse STED imaging shows that membrane invaginations maintain geometry but lose WASP signal as the cell continues moving. Scale bar is 500 nm. (C) Single xz STED slices of beads at the cell front and cell rear of the same cell show that despite similar geometry, WASP is only recruited to invaginations at the front. Images are scaled to the same intensity. Scale bar is 500 nm. (D) WASP colocalizes with the canonical front marker PAK-PBD that reads out active Rac (Weiner et al., 2007). Both WASP and PAK-PBD fail to overlap with clathrin LCa. Scale bar is 5 μm. (E) Comparison of WASP puncta intensity in endogenously tagged WT and Cdc42 KO backgrounds. In addition to being significantly fewer in number in Cdc42 KO cells (Fig. 5 F), the WASP puncta that do form are less than half as bright in the absence of Cdc42. npuncta, WT = 1,211 and npuncta, Cdc42 KO = 247, which were collected across 46 and 40 cells, respectively. P = 0.024 by a paired two-tailed t test on replicate means. (F) Cumulative distribution function of lifetime of puncta in E. WASP puncta lifetime in Cdc42-null cells is 30% less. P = 0.025 by a paired two-tailed t test on replicate means. AU, arbitrary units.

