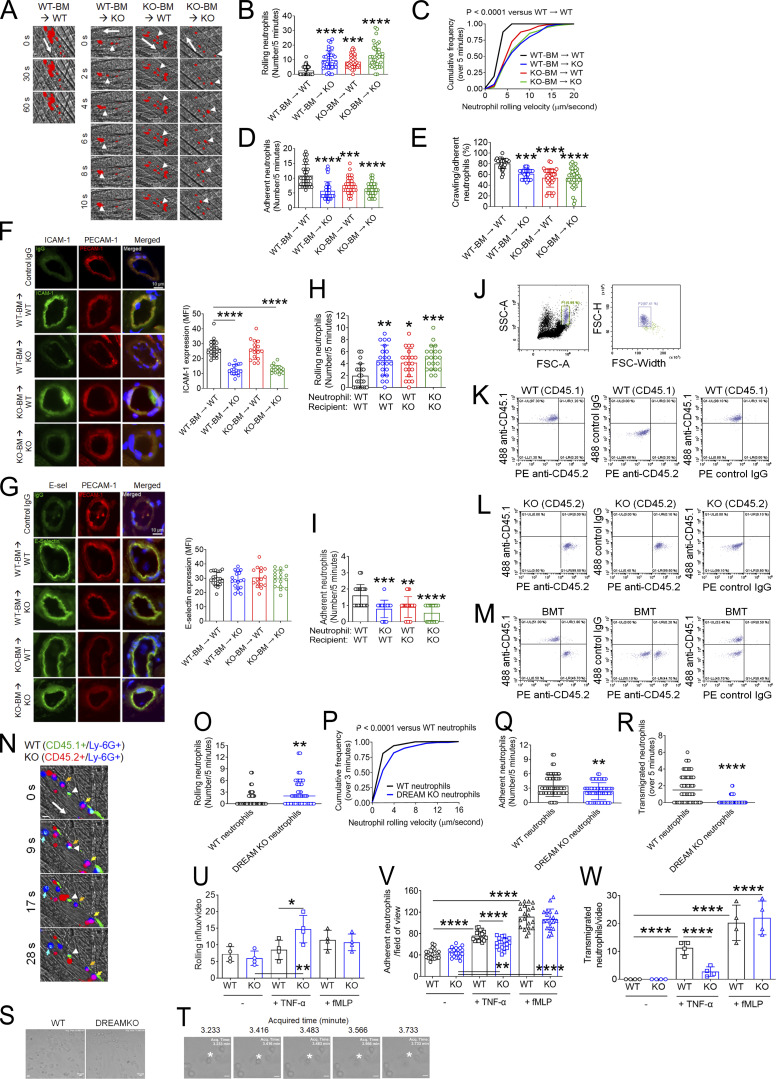
Figure 2.
Neutrophil DREAM contributes to neutrophil recruitment during TNF-α–induced vascular inflammation. Intravital microscopy with BM chimeric mice was performed as described in Fig. 1. (A) Representative images. Large arrows indicate the direction of blood flow. Arrowheads indicate individual rolling neutrophils over 10 s. (B) The rolling number of neutrophils. (C) The cumulative frequency of the rolling velocity of neutrophils. (D and E) The number of adherent neutrophils and the percentage of crawling neutrophils. Data represent the mean ± SD (n = 36–39 venules in six mice/group). (F and G) After intravital microscopy, the cremaster muscle in each mouse was removed and sectioned for immunohistochemistry. Tissue sections were stained for ICAM-1, E-selectin (E-sel), PECAM-1, and DAPI, and used for confocal microscopy. The MFI values of anti–ICAM-1 and anti–E-selectin antibodies were quantified. Data represent the mean ± SD (n = 20 sections in four mice/group). (H and I) Fluorescently labeled WT and DREAM KO neutrophils were adoptively transferred to TNF-α–challenged WT or DREAM KO mice. 5 min later, intravital microscopy was performed. The number of rolling (H) and adherent (I) neutrophils. (J–R) Equal numbers of BM cells isolated from WT (CD45.1) and DREAM KO (CD45.2) were mixed and transplanted into irradiated WT (CD45.1) mice. (J–M) 6 wk after BM transplantation (BMT), blood was drawn. After RBC lysis, cells were labeled with isotype control IgGs, Alexa Fluor 488–conjugated anti-CD45.1, or PE-conjugated anti-CD45.2 antibodies. After gating a single neutrophil (J), the expression of CD45.1 and CD45.2 was evaluated in WT (K), DREAM KO (L), and BM chimeric mice (M) with flow cytometry. The representative data were obtained from three independent experiments. (N–R) BM chimeric mice were treated with intrascrotal injection of TNF-α and used for intravital microscopy. WT and KO neutrophils were visualized with Alexa Fluor 488–conjugated anti-CD45.1 and Alexa Fluor 647–conjugated anti-CD45.2 antibodies, respectively, along with PE-conjugated anti–Ly-6G antibodies. (N) Representative images. WT neutrophils: CD45.1+/Ly-6G+ (cyan) and DREAM KO neutrophils: CD45.2+/Ly-6G+ (purple). Large arrows: the direction of blood flow; small arrows: rolling neutrophils; arrowhead: adherent neutrophils. (O) The number of rolling neutrophils. (P) The cumulative frequency of the rolling velocity of neutrophils. (Q and R) The number of adherent and transmigrated neutrophils. The horizontal bar represents the median value in O and R. Otherwise, data represent the mean ± SD (n = 41–48 venules in five mice/group). (S–W) Flow chamber assays were performed as described in the Materials and methods. (S) TNF-α–stimulated adherent WT and KO neutrophils. (T) Transmigrating TNF-α–stimulated WT neutrophils. (U–W) After a 10-min incubation with or without TNF-α or fMLP, the numbers of rolling, adherent, and transmigrated neutrophils were counted in a field of view (0.15 mm2). Scale bars = 10 µm. Data represent the mean ± SD (n = 4). The number of adherent neutrophils was counted in 4 additional areas (n = 20 fields of view/group). *, P < 0.05; **, P < 0.01; ***, P < 0.001; ****, P < 0.0001 after ANOVA and either Tukey’s test (B, D–I, and U–W) or Kruskal–Wallis test with post hoc Dunn’s test (C), Mann–Whitney U test (O, P, and R), and Student’s t test (Q). SSC-A, side scatter area; FSC-A, forward scatter area; FSC-H, forward scatter height.

