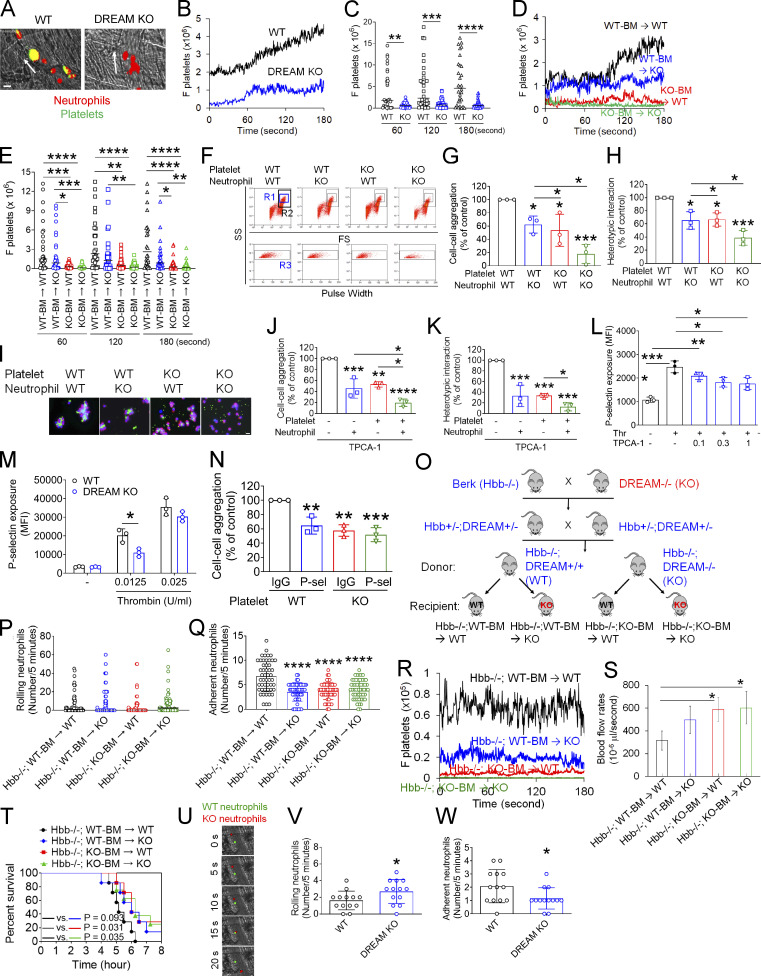
Figure 6.
DREAM positively regulates platelet–neutrophil aggregation and vaso-occlusive events under thromboinflammatory conditions. (A–E) Intravital microscopy on WT, DREAM KO, or BM chimeric mice was performed as described in Fig. 1. Neutrophils and platelets on inflamed venules were visualized with Alexa Fluor 647–conjugated anti–Ly-6G and Dylight 488–conjugated anti-CD42c antibodies, respectively. (A) Representative images. (B and D) The integrated median fluorescence intensity values of the anti-CD42c antibody (F platelets) were normalized to the number of adherent neutrophils and the length of vessels and plotted as a function of time. (C and E) F platelets were compared at 60, 120, and 180 s. The horizontal bar represents the median value (n = 30–32 venules in four mice/group). (F–I) In vitro platelet–neutrophil aggregation was conducted under stirring conditions as described in the Materials and methods. (F) R1, platelet–neutrophil aggregates; R2, neutrophils; and R3, the number of cell aggregates in the R1 gate. Neutrophil–platelet aggregation was quantified by (G) the number of cell–cell aggregates and (H) the fluorescence signal of anti-CD42c antibodies in the R1 gate (heterotypic interaction). (I) Antibody-labeled neutrophils and platelets were mixed under stirring conditions. After cytospin, fluorescence microscopy was performed. Neutrophils: red; platelets: green; DAPI: blue. Representative images (n = 3). (J and K) Human neutrophils and platelets were pretreated with or without 0.3 µM TPCA-1. After labeling with FITC-conjugated anti–L-selectin or APC-conjugated anti-CD41 antibodies, neutrophils and platelets were treated with TNF-α and thrombin, respectively. Cells were mixed, and neutrophil–platelet aggregates were quantified as described above. (L) Human platelets were pretreated with vehicle (−) or 0.1–1 µM TPCA-1 and then with thrombin (Thr). (M) P-selectin exposure was measured in resting and thrombin-activated WT and DREAM KO platelets by flow cytometry. (N) Platelet–neutrophil aggregation was performed as described above. Platelets were treated with thrombin in the presence of control IgG or anti–P-selectin antibodies, incubated with activated WT neutrophils, and then subjected to flow cytometry. Data represent the mean ± SD (n = 3). (O–W) SCD mice deficient in nonhematopoietic and/or hematopoietic DREAM were treated with i.p. injection of TNF-α. Intravital microscopy was conducted as described above. (O) Generation of nonhematopoietic and/or hematopoietic DREAM-deficient SCD mice. (P and Q) The number of rolling and adherent neutrophils. (R) Adherent/aggregating platelets were quantified by the integrated fluorescence intensity value of the anti-CD42c antibody (F platelets). (S) Fluorescently labeled microspheres were injected into all mice, and the centerline velocity was calculated to assess blood flow rates. The horizontal bar represents the median value (n = 20 vessels in four mice/group). Otherwise, data represent the mean ± SD (n = 46–50 [for Q] or 12 venules [for S] in eight mice/group). (T) Survival curves during or after intravital microscopy. (U–W) Equal numbers of calcein-AM–labeled WT and CellTracker Deep Red–labeled DREAM KO neutrophils were injected into TNF-α–challenged SCD mice. Intravital microscopy was performed as described in Fig. 1. (U) Representative images. (V and W) The number of rolling and adherent neutrophils. Scale bars = 10 µm (A, I, and U). *, P < 0.05; **, P < 0.01; ***, P < 0.001; ****, P < 0.0001 after Mann–Whitney U test (C), Student’s t test (M, V, and W), ANOVA and either Kruskal–Wallis test with post hoc Dunn’s test (E) or Tukey’s test (G, H, J–L, N, Q, and S), and Mantel–Cox log-rank test (T). P-sel, P-selectin; SS, side scatter; FS, forward scatter; Berk, Berkeley mice.

