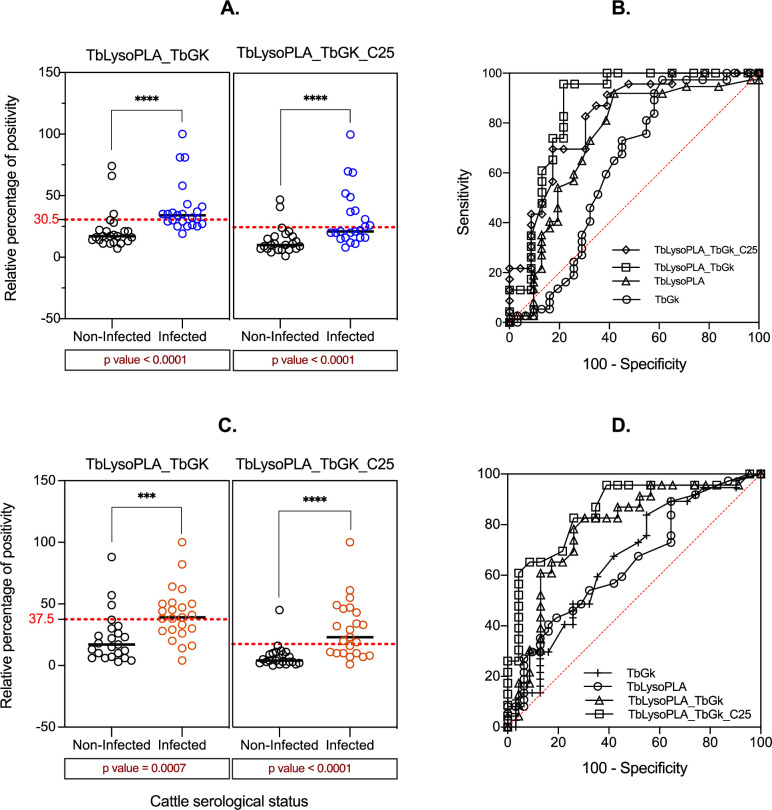
Fig 4. Protein equimolar mixtures as antigen in Ab-ELISA and ROC curve comparison between individual proteins and mixtures.
(A.) bovine sera from T. congolense experimental infection (37 positive and 31 negative sera). (B.) ROC curve of antigens tested with experimental sera: TbLysoPLA (triangle), TbGK (dot), TbLysoPLA_TbGK (square) and TbLysoPLA_TbGK_C25 (rhombus). (C.) field sera from T.b. brucei, T. congolense and T. vivax mixed infection (37 positives and 31 negatives sera). (D.) ROC curve of antigens tested with field sera (same legends as in B). The optimal cut-off value (in A and C) for each antigen is shown in red dashed line. The global diagnostic performance was defined by AUC value.

