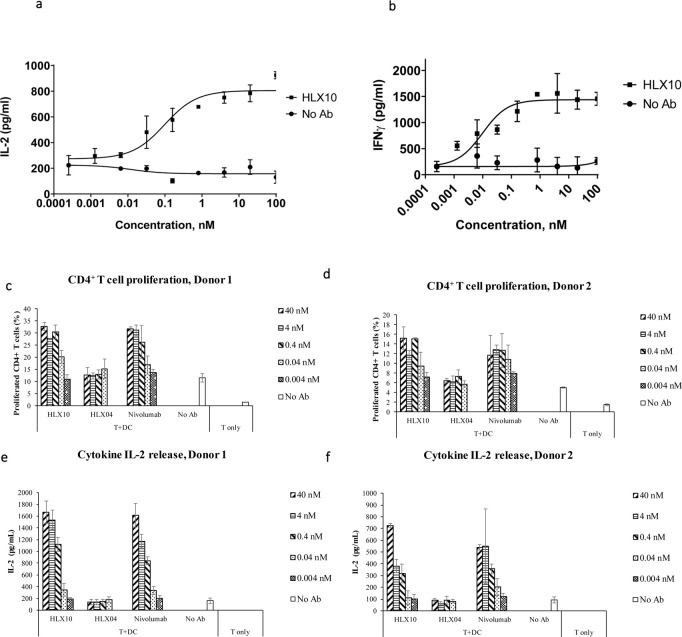
Fig 4. IL-2 and IFN-γ dose–response curve of HLX10 in a mixed DC/CD4+ T-cell MLR assay.
(a, b) IL-2 and IFN-γ levels in the supernatants were determined by ELISA after 48 h and 5 days of culture, respectively. Data are presented as increase in cytokine levels relative to untreated cell (no Ab). Each datapoint represents mean ± SD (n = 3). (c, d) Effect of increasing doses of HLX10 and Nivolumab on CD4+ proliferation, as measured by CFSE staining by flow cytometry of two independent donor pairs. Data are presented (horizontal bar) as percent increase in CFSE stained population relative to untreated, no antibody and T-cell only controls. Each bar represents the mean ± SD. Nivolumab and HLX04 (anti-VEGF) were used as the positive control and negative controls, respectively. (e, f) Same MLR samples were assessed for IL-2 secretion by ELISA. Data are presented as increase in IL-2 levels relative to untreated, no antibody and T-cell only controls. Each graph represents a donor pair, and the horizontal bar is the mean ± SD.

