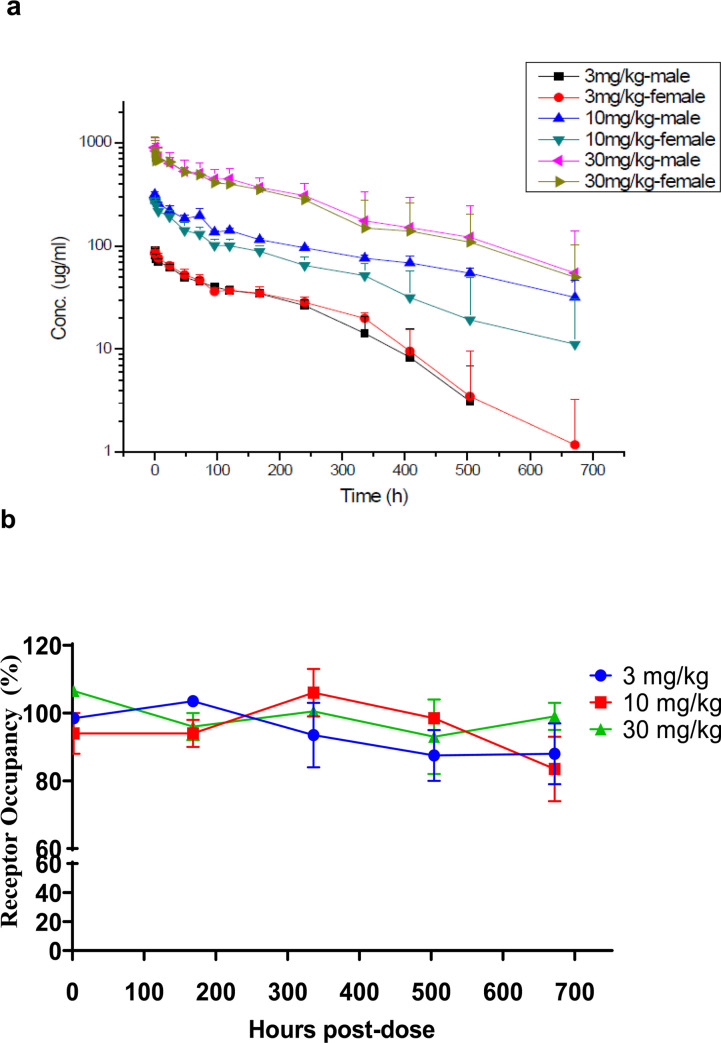
Fig 12. PD-1 receptor occupancy and PK profiles.
(a) Mean Serum drug concentration-time curves of HLX10 following a single IV-infusion at 3, 10 and 30 mg/kg (N = 3). (b) Receptor occupancy rate of HLX10 on PD-1 on the surface of T cells following a single IV-infusion at 3, 10 and 30 mg/kg, which was assessed by flow cytometry.

