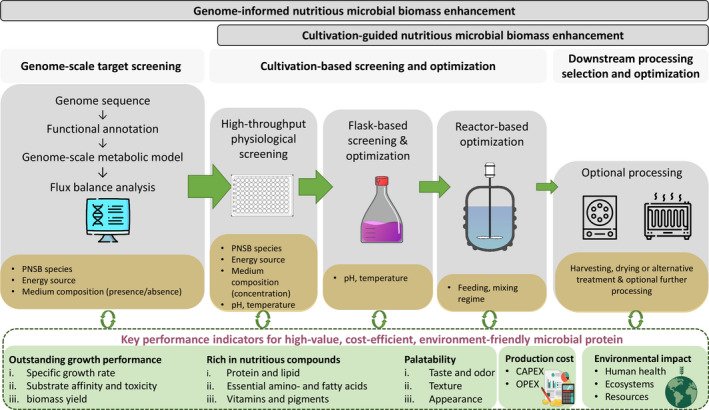
Fig. 2.

Proposed genome‐scale computational approach for targeted screening and nutritional quality steering. Grey boxes show the necessary steps in the route from computational prediction to downstream processing. Yellow boxes represent the variables of each step in the pipeline. The decreasing height of the green arrows depicts the number of variables (parameter values or options) to select in each step. Each step interacts with the key performance indicator. CAPEX, capital expenditure; OPEX, operational expenditure. This figure has been designed using resources from Freepik.com and flaticon.com.
