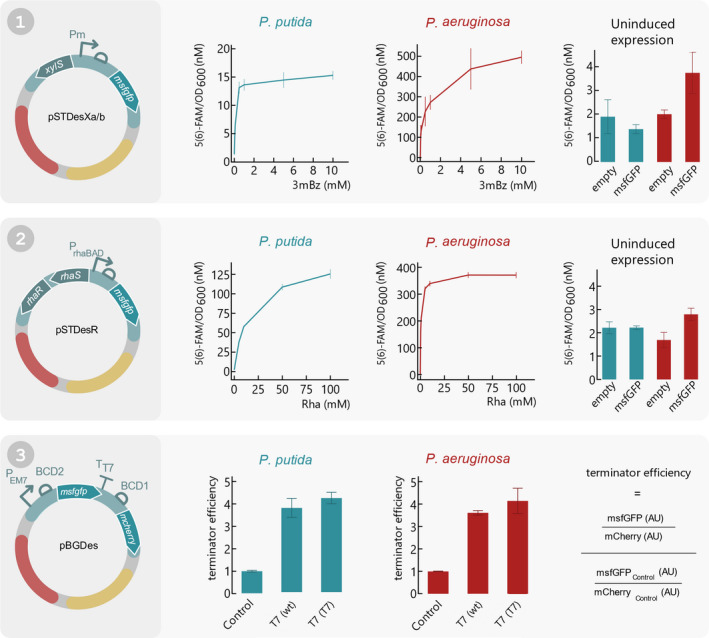
Fig. 4.

Functionality assay of all SEVAtile destination vectors in P. putida KT2440 and P. aeruginosa PAO1. (1) pSTDesXa⋅msfGFP and pSTDesXb⋅msfGFP were electroporated to P. putida KT2440 and P. aeruginosa PAO1, respectively. A fluorescence assay was performed in which the cells were induced with 0; 0.05; 0.1; 0.5; 1; 5; 10 mM 3mBz and the fluorescence signal and OD600 was monitored for 12 h. The fluorescent signal after 10 h of induction in response to the different inducer concentrations is plotted separately for P. putida KT2440 and P. aeruginosa PA01 (left and middle graph, respectively). Furthermore, to assess the leakiness of XylS/Pm in uninduced conditions, the fluorescence signal of hosts carrying pSTDesXa/b·msfGFP after 10 h of cell growth was compared to an empty control vector (right graph). (2) pSTDesR·msfGFP was electroporated to P. putida KT2440 and P. aeruginosa PAO1, after which the fluorescence intensity and OD600 was monitored for 12 h with 0; 1; 5; 10; 50; 100 mM Rha to assess the performance of RhaRS/PrhaB in both hosts. The left and middle graph display the fluorescence intensity in response to the Rha concentration after 10 h of cell growth for P. putida KT2440 and P. aeruginosa PAO1, respectively. The right graph depicts the fluorescence intensity of an uninduced sample compared to an empty control vector after 10 h of cell growth, for both hosts. (3) To show that the SEVAtile technique allows successful formation of genetic constructs with six building blocks, a terminator trap system was generated (Temme et al., 2012). The terminator is flanked by an msfGFP reporter upstream and mCherry reporter downstream in the pBGDes backbone: pBGDes·PEM7‐BCD2‐msfGFP‐BCD1‐mCherry (control), pBGDes·PEM7‐BCD2‐msfGFP‐T7terminator(wt)‐BCD1‐mCherry and pBGDes·PEM7‐BCD2‐msfGFP‐T7terminator(T7)‐BCD1‐mCherry. These vectors were electroporated to P. putida KT2440 and P. aeruginosa PAO1 with pTNS2 to enable genomic integration of the vector into the host’s Tn7 landing site. The fluorescence intensity levels of msfGFP and mCherry of both hosts carrying the different constructs were monitored for 12 h. The termination efficiency after 10 h of cell growth was calculated as displayed on the right and plotted for both hosts for the control construct and the two different terminators. Data points and bars represent the mean value of four replicates, error bars indicate the standard deviation. Full graphs of fluorescence intensity and OD600 are available in the Supporting Information (Figs S2–S5).
