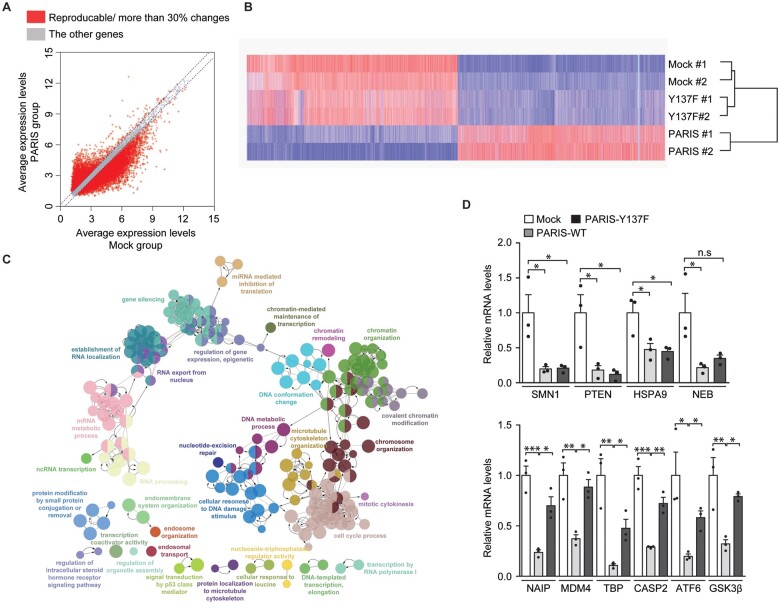
Figure 3.
Microarray analysis reveals PARIS Y137 phosphorylation-dependent gene regulation. (A) Scatter plots of gene expression in the mock (x-axis) and FLAG-PARIS wild-type (y-axis) transfected SH-SY5Y cells generated by microarray analysis. Genes with >30% reproducible alterations in two independent experiments are shown in red, and only these genes were used for subsequent analyses. (B) Hierarchical cluster analysis of genes from A in SH-SY5Y cells transfected with mock, FLAG-PARIS wild-type, or the Y137F-PARIS mutant (n = 2 per group) using complete linkage and Euclidean distance as a measure of similarity. (C) Functional pathway clustering of the genes that are repressed (reproducible and <30% downregulation) in a PARIS Y137 phosphorylation-dependent manner using the Cytoscape ClueGO plugin. (D) Quantification and validation of select gene transcripts with Y137 phosphorylation-dependent and -independent repression (microarray analysis) by reverse transcription quantitative PCR [RT-qPCR; Y137 phosphorylation-independent genes in microarray: SMN1, PTEN, HSPA9, NEB; Y137 phosphorylation-dependent genes in microarray: NAIP, MDM4, TBP, CASP2, ATF6, GSK3B (GSK3β); n = 3 per group]. Data are expressed as mean ± SEM. Statistical analysis was performed using a one-way ANOVA test followed by Tukey’s post hoc analysis. *P < 0.05, **P < 0.01 and ***P < 0.001. n.s. = non-significant. WT = wild-type.

