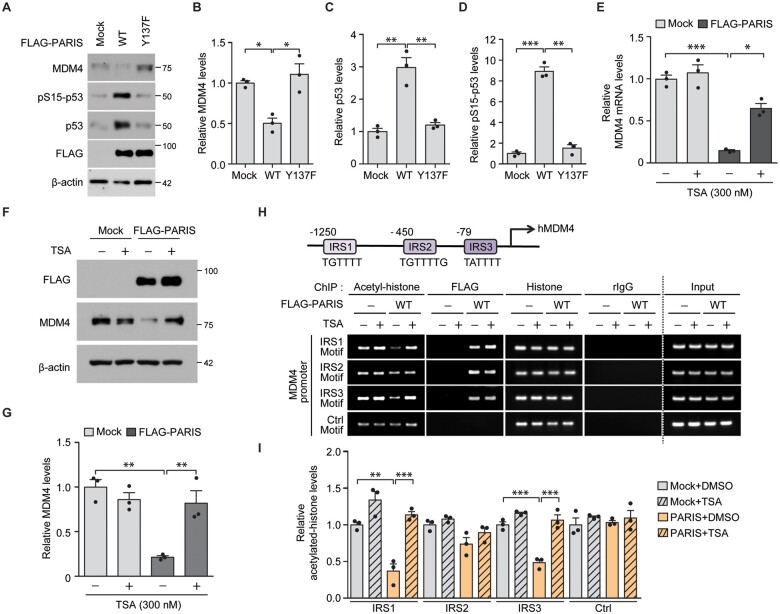
Figure 4.
PARIS expression leads to p53 activation via PARIS Y137 phosphorylation-dependent epigenetic repression of MDM4. (A) Representative immunoblots examining the expression of MDM4, pS15-p53, p53 and FLAG (PARIS) in SH-SY5Y cells transfected with FLAG-PARIS wild-type or a Y137F mutant (48 h) using the indicated antibodies. β-Actin serves as an internal loading control. (B–D) Relative expression levels of MDM4 (B), p53 (C) and pS15-p53 (D) in the indicated experimental groups from A normalized to the internal loading control (β-actin; n = 3 per group). (E) Quantification of the relative expression of MDM4 mRNA in SH-SY5Y cells transfected (48 h) with mock or FLAG-PARIS and treated with TSA (300 nM, 42 h) determined by RT-qPCR (normalized to internal GAPDH loading control; n = 3 per group). (F) Representative immunoblots of FLAG (PARIS) and MDM4 expression in SH-SY5Y cells transfected (48 h) with mock or FLAG-PARIS and treated with TSA (300 nM, 42 h). (G) Quantification of the relative expression of MDM4 protein in the experimental groups in F normalized to β-actin (n = 3 per group). (H) A schematic diagram depicting the promoter structures of human MDM4 (hMDM4). IRS1, IRS2 and IRS3 motifs are indicated (top). Anti-acetyl-histone and anti-FLAG ChIP analysis of putative IRS (motif 1, 2 and 3) within the MDM4 promoter region in SH-SY5Y cells transfected with mock, or FLAG-PARIS wild-type (48 h, bottom) with or without the HDAC inhibitor TSA (300 nM, 42 h). The non-IRS region within the MDM4 promoter (Ctrl motif) was used as a negative control. Samples immunoprecipitated using either anti-histone antibodies or rabbit IgG were included as experimental controls in ChIP assays. (I) Quantification of relative acetylated histone enrichment on the indicated motifs located within MDM4 promoter determined by PCR amplification of ChIPed DNA in H (n = 3 per group). Data are expressed as mean ± SEM. *P < 0.05, **P < 0.01 and ***P < 0.001 and statistical analysis was performed using an ANOVA test followed by Tukey’s post hoc analysis. WT = wild-type.

