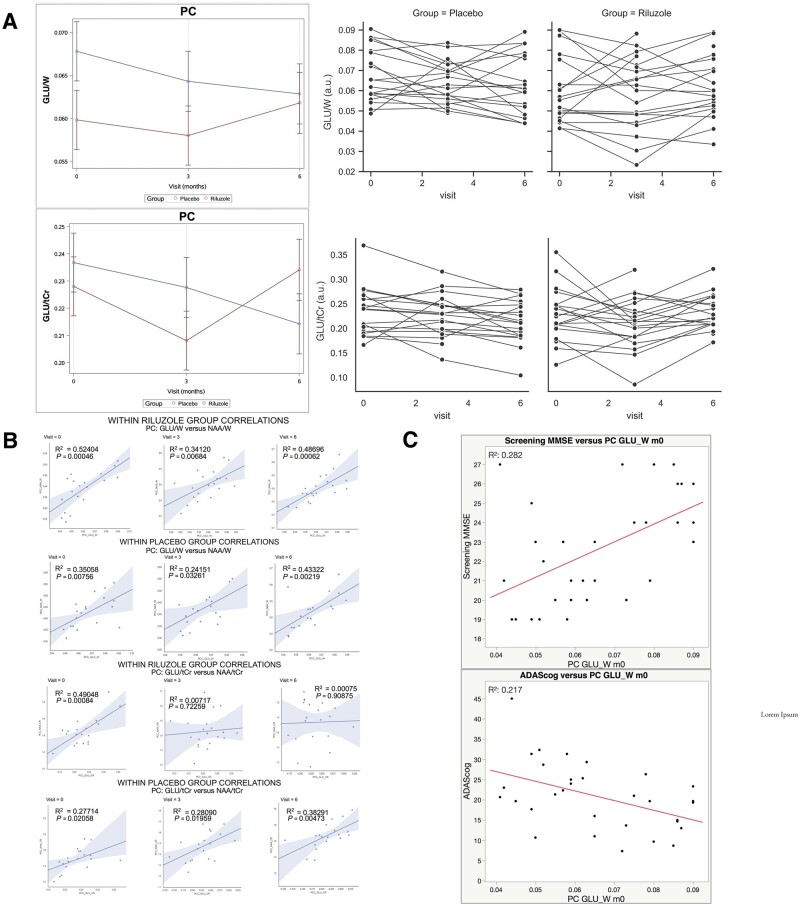
Figure 7 Comparison of changes in 1H MRS measures.
(A) 1H MRS measures of Glu/W (top) and Glu/tCr (bottom) levels changes in PC at baseline, 3 and 6 months. (B) Correlations at baseline, midpoint and end point between NAA/W and Glu/W in riluzole and placebo groups (top) and NAA/tCr and Glu/tCr in riluzole and placebo groups (bottom). (C) Correlations at baseline between Glu/W and MMSE (top) and Glu/W and ADAS-cog (bottom) across participants.

