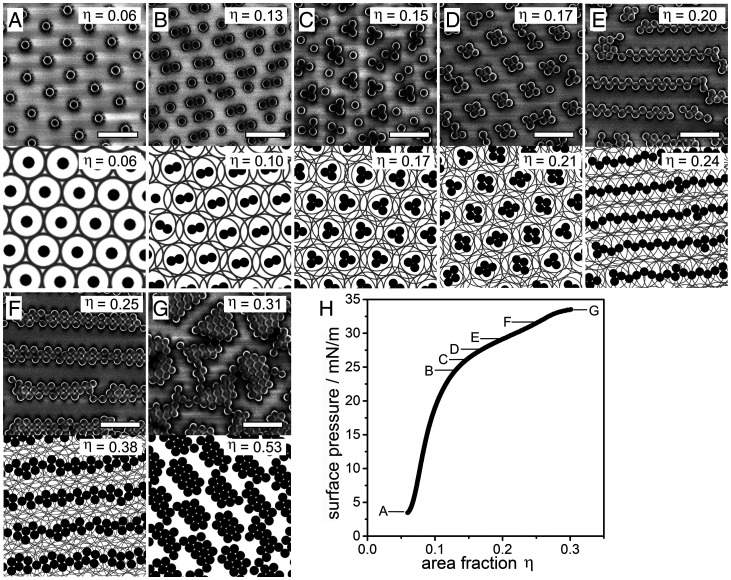
Fig. 3.
Phase behavior of the core–shell system upon compression in experiment and MC simulations based on particles interacting via a Jagla potential with a linear ramp potential and shell-to-core ratio . (A–G) Representative SEM image of characteristic phases observed in experiment (Top row) and snapshots of the MC simulations (Bottom) at different area fractions specified in the images. (H) Surface pressure-area fraction isotherm indicating the regions in which the phases are observed (Scale bar: 1 µm).

