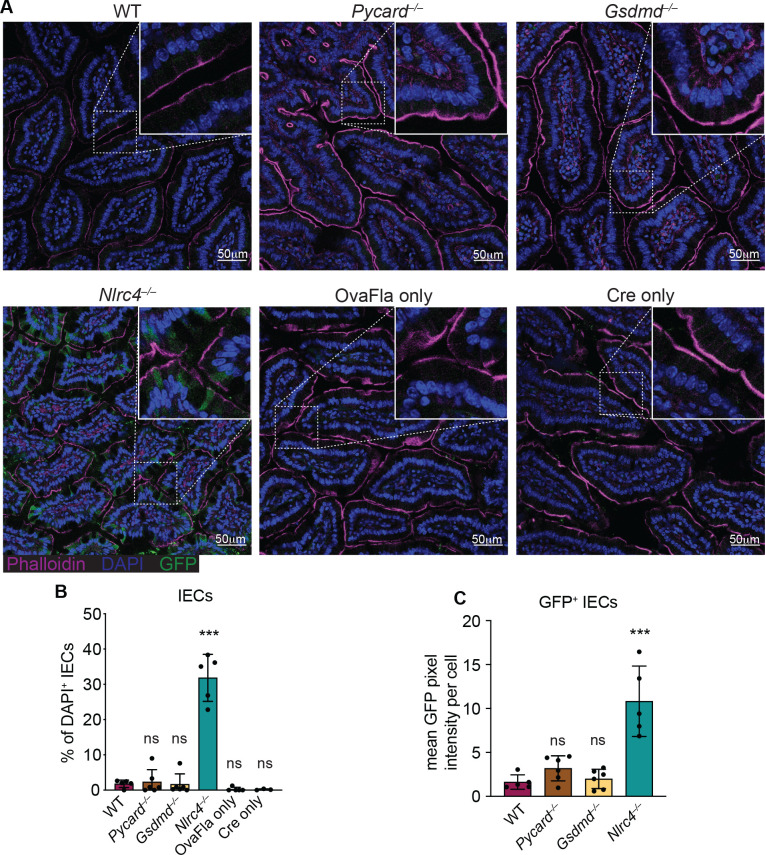
Figure 2. GFP+ cells accumulate in Nlrc4–/– OvaFla mice following tamoxifen administration.
(A) Representative immunofluorescence images of the small intestines of indicated OvaFla mice on day 2 following a single day pulse of tamoxifen chow. (B) Quantification of DAPI+ IECs that are also GFP+ for each OvaFla line. Approximately 100 cells from least 15 separate villi across four to five images were counted per mouse. (C) Quantification of mean GFP pixel intensity for GFP+ intestinal epithelial cells (IECs) in each OvaFla line. Data represent an averaged value from 12 to 20 cells per image across four to five images per mouse. (B–C) Data are pooled from two biological replicates, and each dot represents an individual mouse. Data shown as mean ± SD. Significance calculated using one-way ANOVA and Tukey’s multiple comparisons test (*p < 0.05, **p < 0.01, ***p < 0.001). Only p values between wild-type (WT) and other experimental groups are shown. See Figure 2—source data 1 for exact p values.

