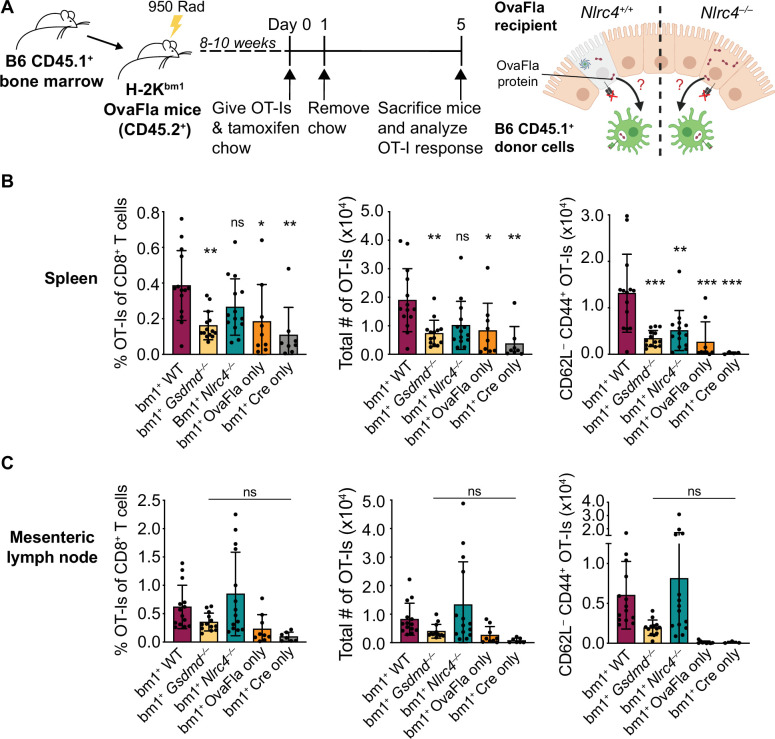
Figure 4. OvaFla expression in intestinal epithelial cells (IECs) results in OT-I cross-priming that is independent of NLRC4 but partially dependent on gasdermin D.
(A) Schematic depicting the production and analysis workflow of chimeric bm1+OvaFla mice (left). At the right, an illustration of either wild-type (WT) OvaFla mice (left of the dashed line) or Nlrc4–/– OvaFla mice (right of the dashed line) following lethal irradiation and reconstitution with bone marrow from B6.SJL mice. (B) Quantification of OT-Is as a percent of total CD8+ T cells (left), the total number of OT-Is (middle), and the total number of CD62L–CD44+ OT-Is (right) in the spleen. (C) Quantification of OT-Is as a percent of total CD8+ T cells (left), the total number of OT-Is (middle), and the total number of CD62L–CD44+ OT-Is (right) in the mesenteric lymph nodes. Tissues were harvested and analyzed at day 5 post tamoxifen chow start. (B–C) Data are pooled from three biological replicates, and each dot represents an individual mouse. Data shown as mean ± SD. Significance calculated using one-way ANOVA and Tukey’s multiple comparisons test (*p < 0.05, **p < 0.01, ***p < 0.001). Only p values between WT and other experimental groups are shown. See Figure 4—source data 1 for exact p values.


