. 2021 Dec 31;10:e68213. doi: 10.7554/eLife.68213

Figure 2. TMEM223 is a mitochondrial membrane protein.

(A) Membrane topology of TMEM223. The predicted transmembrane spans (TM1 and TM2) with corresponding amino acids (aa) are indicated. IMS: intermembrane space; IMM: inner mitochondrial membrane. (B) and (C) Submitochondrial localization of TMEM223. Wild-type (WT) mitochondria were treated with Proteinase K (PK) under iso-osmotic (Mito), hyper-osmotic conditions (swelling, MP), or solubilized with Triton X-100 (TX-100) (B). The unspecific band is marked with an asterisk. Mitochondrial proteins were extracted in sodium carbonate containing buffer at different pH (total, T; pellet, P; soluble fraction, S) (C). (D) Protein steady-state levels in TMEM223−/− cells. Mitochondrial lysates from WT and TMEM223−/− cells were analyzed by western blotting using indicated antibodies and protein amounts were quantified using ImageQuant software (mean ± SEM, n=3). (E) Isolated mitochondria from WT and TMEM223−/− cells were solubilized in DDM-containing buffer, separated on 2.5–10% (Complex I) or 4–13% (Complexes II–V) BN-PAGE and analyzed by western blotting. OXPHOS complexes were detected with indicated antibodies and amounts quantified using ImageQuant software(mean ± SEM, n=3).

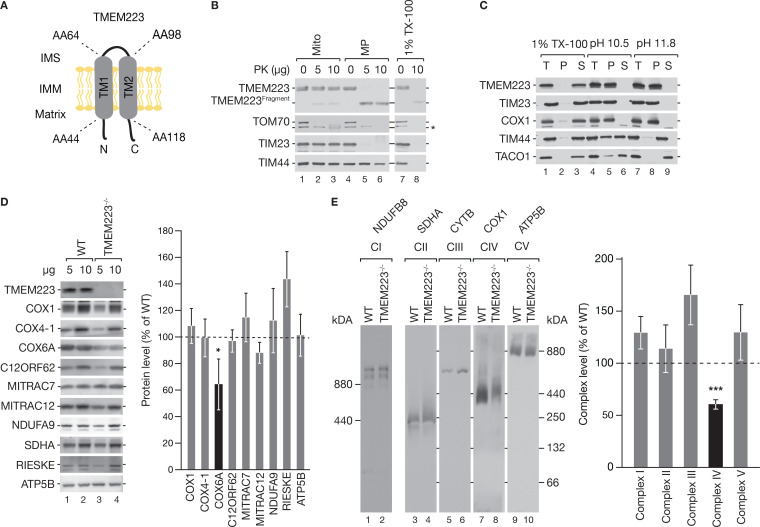
Figure 2—source data 1. Data of Figure 2B–E.

Figure 2.

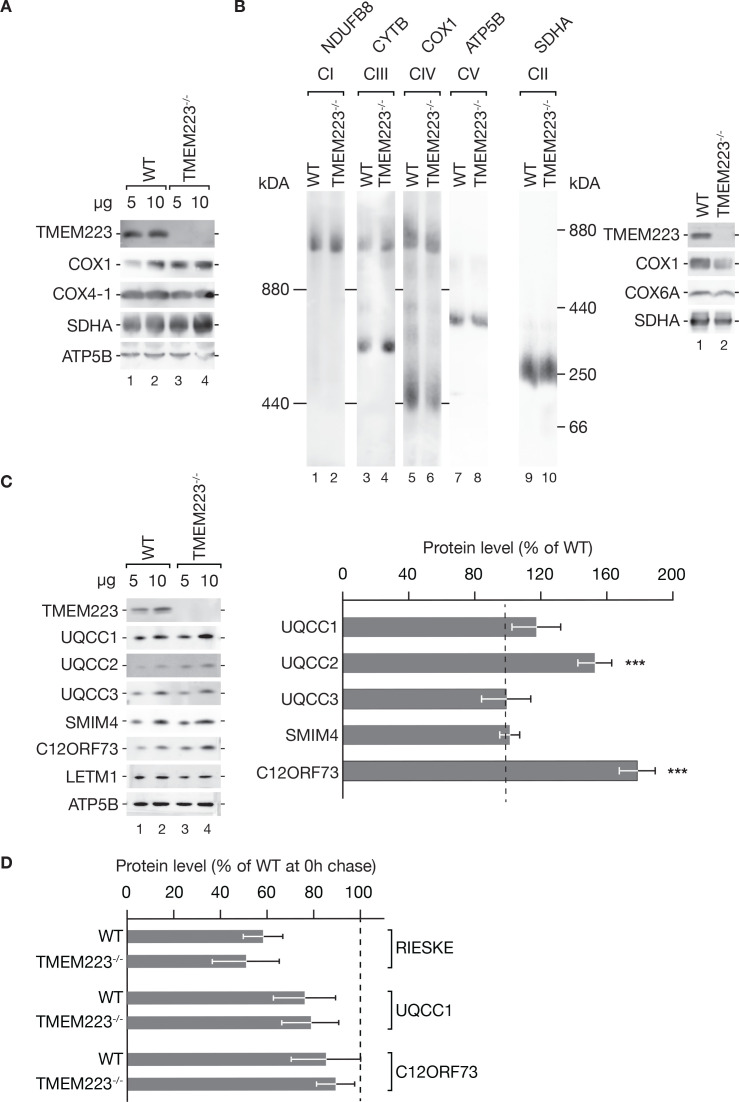
Figure 2—figure supplement 1. Loss of TMEM223 increases the level cytochrome c reductase.

Figure 2—figure supplement 1.

(A) BN-PAGE loading control corresponding to Figure 2E. Isolated mitochondria were subjected to BN-PAGE analyses (Figure 2E) or to SDS-PAGE and western blotting to confirm equal loading of the BN-PAGE. (B) Isolated mitochondria from TMEM223−/− and control cells were solubilized using digitonin buffer, separated on 2.5–10% (complexes I, III and IV) or 4–13% (complex II) BN-PAGE, analyzed by western blotting, and complexes were detected with indicated antibodies (mean ± SEM, n=3). A fraction of the isolated mitochondria was subjected to SDS-PAGE and western blotting analysis as a loading control (right panel). (C) Steady-state protein analysis of selected cytochrome c reductase related proteins in TMEM223−/− cells. Mitochondria were isolated, subjected to western blotting, and probed with indicated antibodies (left panel). The steady-state amount of the indicated proteins was quantified using ImageQuant software (mean ± SEM, n=3). (D) Stability of cytochrome c reductase related proteins. Control cells and TMEM223−/− cells were treated with thiamphenicol (final 50 µg/ml) for 48 hr and cell lysates subjected to western blotting. Signals were quantified with ImageQuant software and graphed (mean ± SEM, n=3).
Figure 2—figure supplement 1—source data 1. Data of Figure 2—figure supplement 1A, B, C.