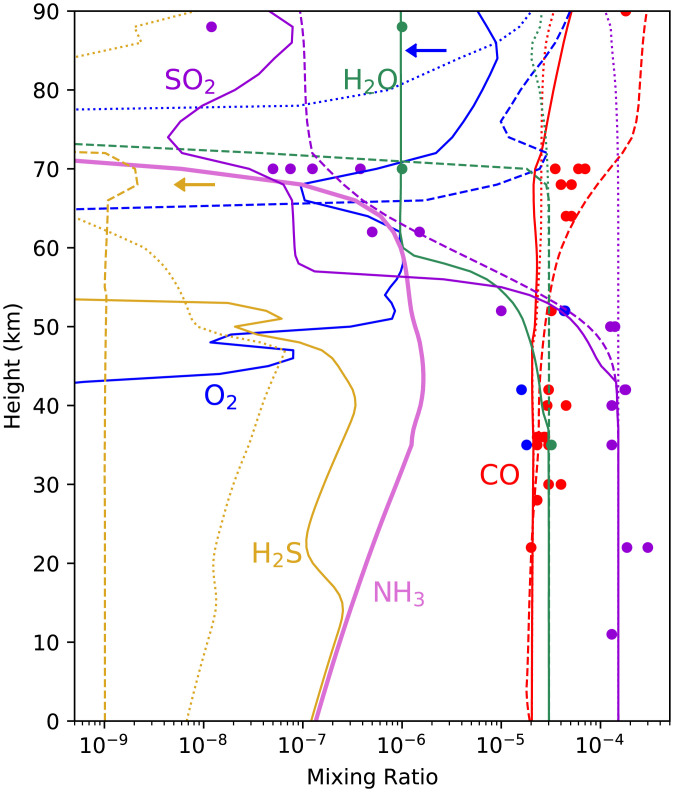
Fig. 3.
Venus atmosphere abundance profiles of key molecular species. The x axis is the gas fraction by volume, called the mixing ratio. The y axis is altitude above the surface in kilometers. The lines are gas mixing ratios from our models: with NH3 chemistry (solid lines), without NH3 chemistry (dotted lines; model in ref. 20), and without NH3 but with an arbitrary removal rate for SO2 in the cloud layers tuned to fit the data (dashed lines; model in refs. 20 and 34). The colored circles show a representative subset of collated remote and in situ data (error bars not shown) from refs. 20 (their table 4) and 33 (their supplementary table S3). Key is that the baseline model predicts no NH3 or H2S above the 1-ppb level. Models with NH3 chemistry have very different H2O, SO2, O2, and H2S values at some altitudes than models without NH3 chemistry, and improve the match to observational data. The main takeaway is that the model without NH3 and without the SO2 arbitrary removal rate (dotted line) fits the cloud layer data very poorly, whereas the model with NH3 (with no arbitrary constraints; solid line) fits the data much better. The boundary conditions for surface abundance in the photochemical model are listed in SI Appendix, Table S6.

