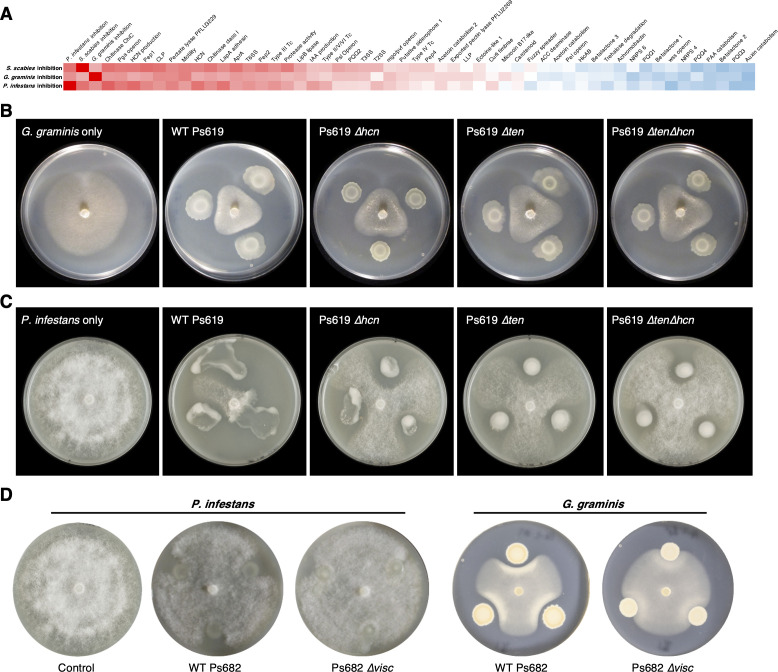
Appendix 2—figure 1. Genotypes and phenotypes that correlate with the suppression of different plant pathogens.
(A) Heatmap of Pearson correlation coefficients of pathogen inhibition versus genotypes and phenotypes (see Figure 3—figure supplement 1 for full correlations; the same color scale is used). (B) On-plate inhibition of G. graminis growth by wild-type (WT) and mutant Ps619 strains. (C) On-plate inhibition of P. infestans growth by WT and mutant Ps619 strains. (D) WT and mutant Ps682 activity towards P. infestans and G. graminis.

