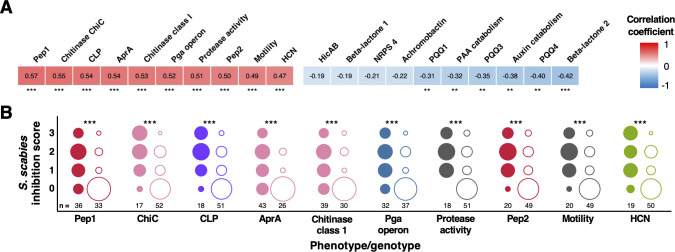
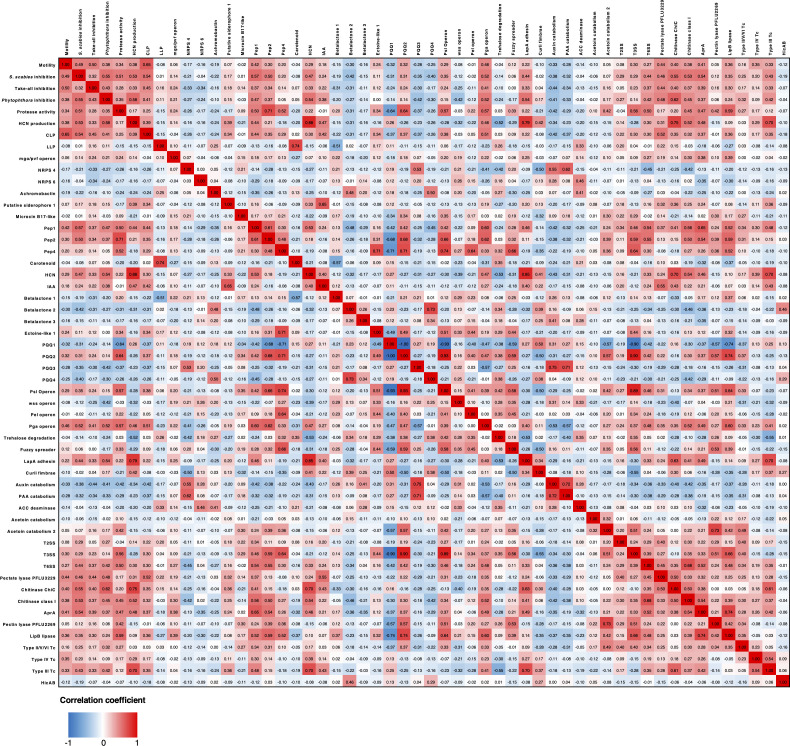
Figure 3. Correlation of biosynthetic gene clusters (BGCs) and accessory genome loci with S. scabies inhibition.
(A) Heatmap showing the 10 genotypes and phenotypes that correlated most strongly (positively and negatively) with on-plate suppression of S. scabies. Stars represent the statistical significance of a correlation using a two-tailed Mann–Whitney test (*p<0.05, **p<0.01, ***p<0.001). (B) Distributions of S. scabies suppressive activity for top 10 positive correlations. Circles are stacked from no (0) to high (3) inhibition, where filled and empty circles represent strains with and without a given genotype/phenotype, respectively. The number of strains (total = 69) in each class is listed, and the area of a circle specifies the proportion of strains with given suppressive activity.


