. 2021 Nov 18;10:e71900. doi: 10.7554/eLife.71900

Figure 4. Mass spectral networking analysis of liquid chromatography–tandem mass spectrometry (LC-MS/MS) data from the Pseudomonas strains used in this study.

Node area is proportional to the number of distinct strains where MS/MS data were acquired for a given metabolite. Node color reflects the proportion of MS/MS scans for a given node that come from strains with a S. scabies inhibition score ≥1. Nodes are labeled with the corresponding parent masses and nodes that relate to lipopeptides are labeled (multiple networks arise from differential fragmentation of [M + H]+, [M + 2H]2+, and [M + Na]+ ions). Line thickness is proportional to the cosine similarity score calculated by Global Natural Product Social Molecular Networking (GNPS) (Aron et al., 2020). The table shows production of lipopeptides by strains containing lipopeptide biosynthetic gene clusters (BGCs). Color coding reflects level of S. scabies inhibition by each strain with same scale as Figure 2 (LLP: linear lipopeptide; all others are cyclic lipopeptides [CLPs]).

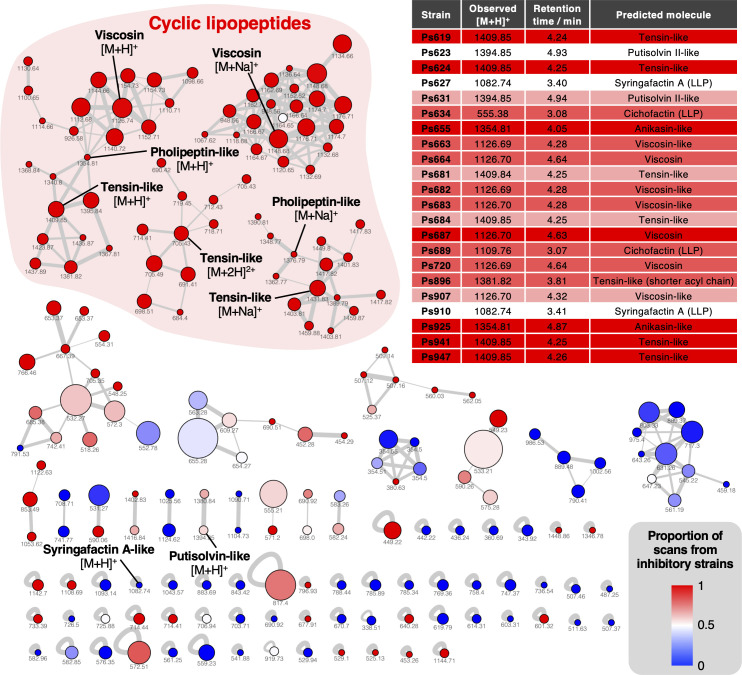
Figure 4.

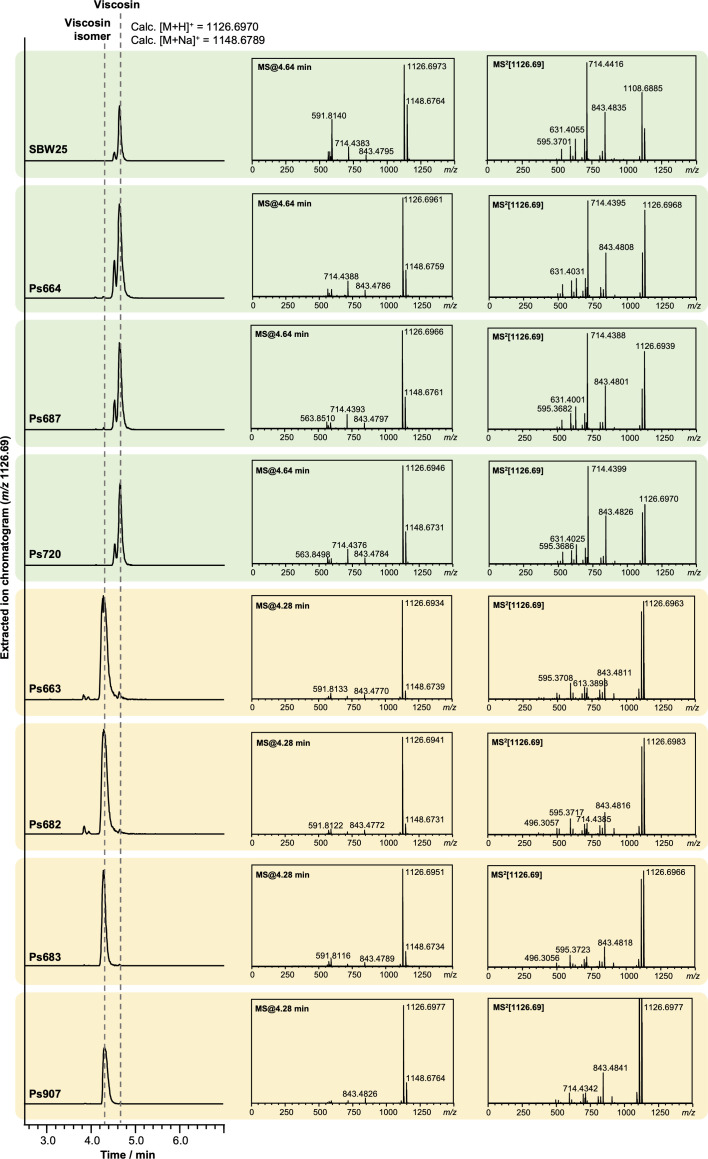
Figure 4—figure supplement 1. Liquid chromatography–tandem mass spectrometry (LC-MS/MS) spectra showing that some strains produce viscosin (identical retention time and MS/MS fragmentation to viscosin produced by P. fluorescens SBW25; green boxes) and some produce an isomer with a distinct retention time and MS/MS fragmentation pattern (yellow boxes).

Figure 4—figure supplement 1.

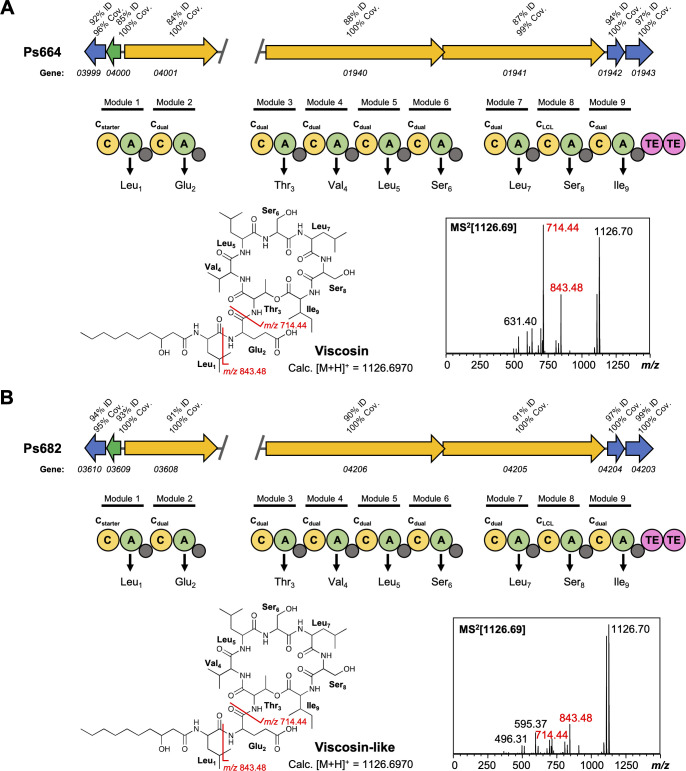
Figure 4—figure supplement 2. Comparison of viscosin (A) and viscosin-like (B) biosynthetic gene clusters (BGCs).

Figure 4—figure supplement 2.

Genes encoding regulatory proteins are green, transporter genes are blue, and nonribosomal peptide synthetases (NRPS) genes are yellow. The break in the BGC indicates that the BGC is found in two distinct genomic loci. Homology to the Pseudomonas fluorescens SBW25 viscosin BGC is shown in both panels (A) and (B). The NRPS organization is displayed, where C = condensation domain, A = adenylation domain, TE = thioesterase, and small gray circles are peptidyl carrier protein domains. Amino acids incorporated by each module are displayed, along with predicted condensation domain specificity. MS/MS data showing characteristic viscosin fragmentation are also shown.
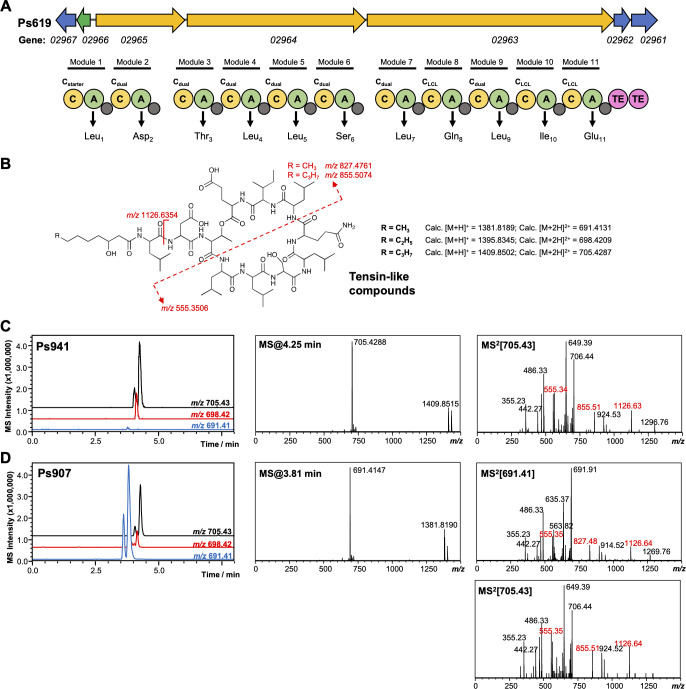
Figure 4—figure supplement 3. Genetic and liquid chromatography–tandem mass spectrometry (LC-MS/MS) analysis of tensin-like compounds.

Figure 4—figure supplement 3.

(A) Organization of the cyclic lipopeptide (CLP) nonribosomal peptide synthetase (NRPS) biosynthetic gene cluster (BGC) from Ps619. Gene and NRPS domain colors are the equivalent to Figure 4—figure supplement 2. Amino acids predicted to be incorporated by each module are displayed, along with predicted condensation domain specificity. (B) Predicted structure, masses, and key MS/MS fragments for tensin-like compounds. (C) Representative LC-MS spectra for another producer of a tensin-like molecule, where the major product [M + 2H]2+ = 705.43. Extracted ion chromatograms are shown for m/z values relating to different acyl chain lengths. Characteristic MS/MS fragments are highlighted in red. (D) LC-MS spectra of tensin-like compounds produced by Ps907, where the major product [M + 2H]2+ = 691.41. The presence of characteristic MS/MS fragments, as well as a smaller amount of [M + 2H]2+ = 705.43, is consistent with a shorter acyl chain (see B).
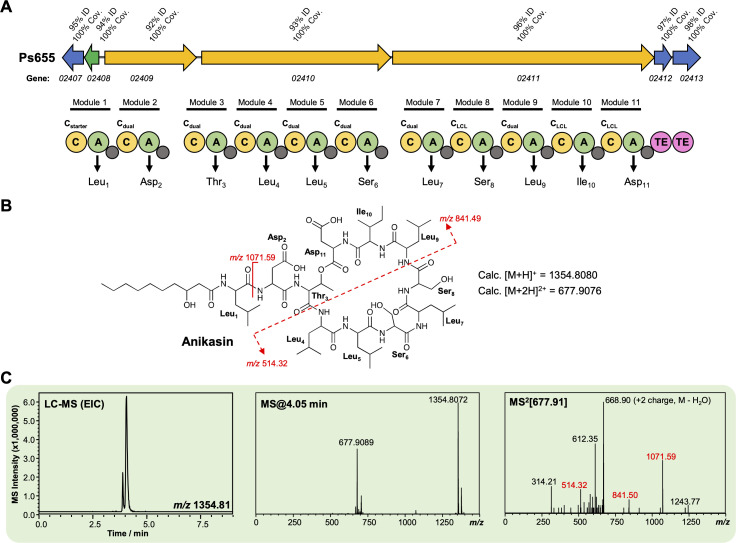
Figure 4—figure supplement 4. Characterization of an anikasin-like lipopeptide from strain Ps655.

Figure 4—figure supplement 4.

(A) Gene cluster listing the homology to the Pseudomonas fluorescens HKI0770 anikasin biosynthetic gene cluster (BGC) (MiBIG BGC0001509). The nonribosomal peptide synthetase (NRPS) organization is displayed (color coding and nomenclature as in Figure 4—figure supplement 2) and amino acids incorporated by each module are displayed, along with predicted condensation domain specificity. (B) Structure of anikasin showing calculated masses for observed MS/MS fragmentation. (C) Liquid chromatography–tandem mass spectrometry (LC-MS) data showing production of an anikasin-like molecule by Ps655 (EIC, extracted ion chromatogram). Red MS/MS fragments relate to fragments shown in panel (B) and are equivalent to the tensin fragments shown in Figure 4—figure supplement 3. A variety of isomers of anikasin have been reported (Götze et al., 2017), such as arthrofactin and pholipeptin.
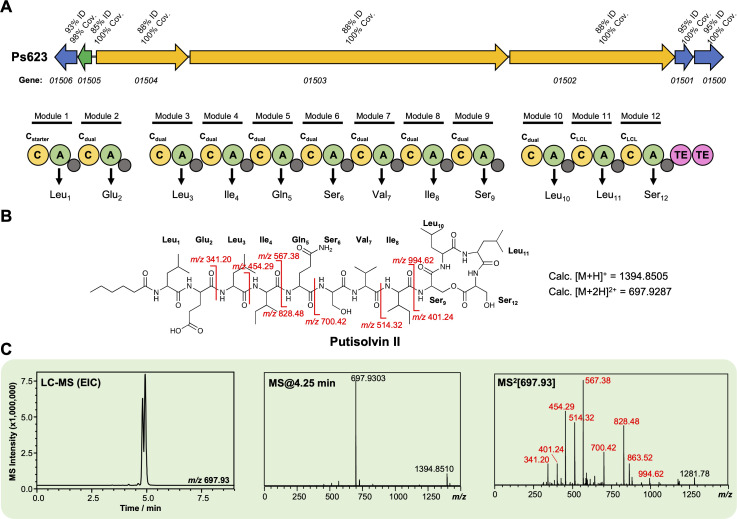
Figure 4—figure supplement 5. Characterization of a putisolvin II-like lipopeptide from strain Ps623.

Figure 4—figure supplement 5.

(A) Gene cluster listing the homology to the Pseudomonas putida PCL1445 putisolvin biosynthetic gene cluster (BGC) (MiBIG BGC0000411). The nonribosomal peptide synthetase (NRPS) organization is displayed (color coding and nomenclature as in Figure 4—figure supplement 2) and amino acids incorporated by each module are displayed, along with predicted condensation domain specificity. (B) Structure of putisolvin II showing calculated masses for observed MS/MS fragmentation. (C) Liquid chromatography–tandem mass spectrometry (LC-MS) data showing production of a putisolvin II-like molecule by Ps623 (EIC, extracted ion chromatogram). Red MS/MS fragments relate to fragments shown in panel (B).
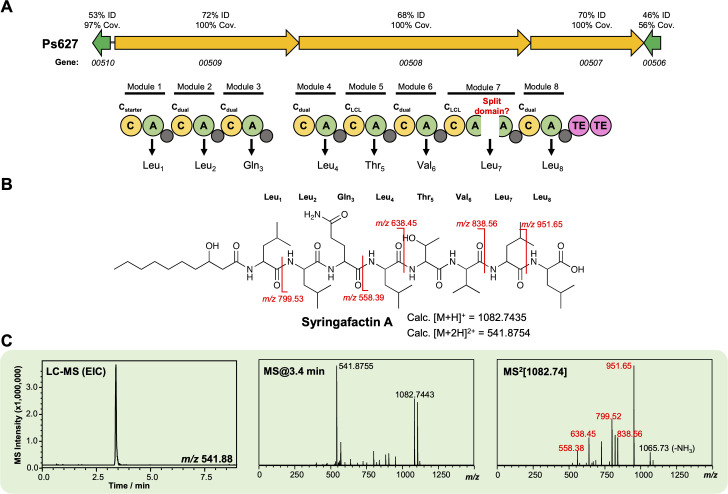
Figure 4—figure supplement 6. Characterization of a syringafactin-like lipopeptide from strain Ps627.

Figure 4—figure supplement 6.

(A) Gene cluster listing the homology to the P. syringae DC3000 syringafactin biosynthetic gene cluster (BGC) (MiBIG BGC0000435). The nonribosomal peptide synthetase (NRPS) organization is displayed (color coding and nomenclature as in Figure 4—figure supplement 2) with an unexpected ‘split’ A domain. Further experiments are needed to determine whether this is real or a sequencing artifact. Amino acids incorporated by each module are displayed, along with predicted condensation domain specificity. (B) Structure of syringafactin A showing calculated masses for observed MS/MS fragmentation. (C) Liquid chromatography–tandem mass spectrometry (LC-MS) data showing production of a syringafactin-like molecule by Ps627 (EIC, extracted ion chromatogram). Red MS/MS fragments relate to calculated fragments shown in panel (B).
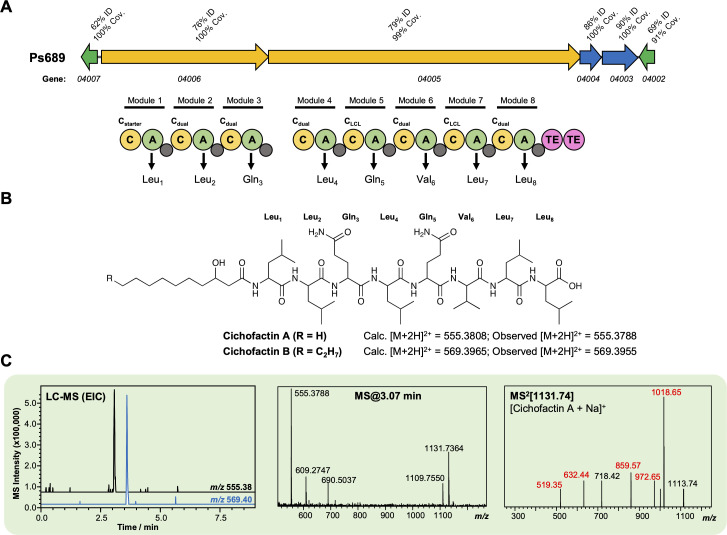
Figure 4—figure supplement 7. Characterization of a cichofactin-like lipopeptide from strain Ps689.

Figure 4—figure supplement 7.

(A) Gene cluster listing the homology to the Pseudomonas cichorii cichofactin biosynthetic gene cluster (BGC) (MiBIG BGC0000323). The nonribosomal peptide synthetase (NRPS) organization is displayed (color coding and nomenclature as in Figure 4—figure supplement 2). Amino acids incorporated by each module are displayed, along with predicted condensation domain specificity. (B) Structure of cichofactins showing calculated and observed [M + 2H]2+ values. (C) Liquid chromatography–tandem mass spectrometry (LC-MS) data showing production of a cichofactin-like molecules by Ps689 (EIC, extracted ion chromatogram). Red MS/MS fragments relate to fragments reported for [cichofactin A + Na]+ in Pauwelyn et al., 2013.